
Application Note
Exploring the effect of shaking conditions on microbial growth
- Easy to set up personalised workflow with shaking for your microbial growth experiments
- High-throughput microbial growth assays with ready to-run protocols for peace of mind
- SoftMax Pro software simplifies growth curve data analysis with automated Vmax calculation
Stanimira Valeva, PhD | Molecular Devices
Tom Delmulle, PhD, Elvira Bytyqi, Stijn Bovijn | Centre for Industrial Biotechnology and Biocatalysis (InBio.be), Ghent University
Introduction
Many laboratories around the world run microbial growth assays in a microplate to follow multiple samples over time, avoiding the need to laboriously pipette from a tube to cuvette, decreasing the risk of contamination and increasing assay throughput. Often, turbidimetry measurements are multiplexed with fluorescence or luminescence readings to follow marker expression.
The main factors that affect microbial growth in culture are temperature, access to oxygen (aerobic or anaerobic conditions), and medium composition. For aerobic strains, cultures are shaken to aerate the medium, allowing better access to nutrients, and to resuspend cells that may otherwise sediment. Furthermore, keeping the cells in suspension is crucial to maintain the consistency of absorbance measurements.
Flask-grown cultures are typically shaken between 80 to 250 RPM during the assay. The smaller surface area in a microtiter plate means higher surface tension1, so microplate readers usually shake samples at higher RPM, from 300 RPM to 1500 RPM. This helps break the surface tension and allows sufficient agitation of the medium. However, shaking too vigorously can damage cells and impact growth or production2,3.
In such cases, intermittent shaking might be an alternative to long-term continuous shaking in a microplate reader. Shaking briefly (a few seconds) but frequently (every few minutes) could allow sufficient oxygenation of the medium and help to resuspend the cells, maintaining the health of your samples.
We have collaborated with scientists from the InBio.be group, who specialize in the development of various microorganisms for bioproduction, to test the effect of intermittent or continuous shaking on the growth of several prokaryotic and eukaryotic strains at different temperatures or in different growth media.
Here we show that certain microorganisms can grow well with intermittent shaking, and we suggest testing different shaking intervals, which can be easily set up in a SoftMax Pro Workflow to create an optimised process combining multi-mode measurements.
Materials
- SpectraMax® iD3 Multi-Mode Microplate Reader (Molecular Devices, cat. #iD3) with
- SoftMax® Pro Software
- 96-well clear flat-bottom plates, sterile (Greiner cat. #655161)
- 96-well black flat-bottom plates (Greiner cat. #655077) used for fluorescence in Fig. 5
- Bacterial or yeast strains grown by InBio.be (Ghent University) in their appropriate media. Strain names are kept confidential and referred to as prokaryote A, prokaryote B, etc.
Methods
Different prokaryotic and eukaryotic strains were grown in their appropriate media according to the SoftMax Pro workflows shown in Figure 1.
Absorbance values were normalised through the SoftMax Pro software data reduction menu with the following equation: Ln (OD600 / ODT0) by applying the formula Ln(!Lm1/Min(!Lm1)) as custom settings. Vmax was calculated automatically using the maximum number of data points to give the highest squared correlation coefficient (R2). For detailed information regarding kinetic data analysis in SoftMax Pro, please refer to the following application note: Advanced kinetic analysis of Advanced kinetic analysis of a bacterial growth assay.
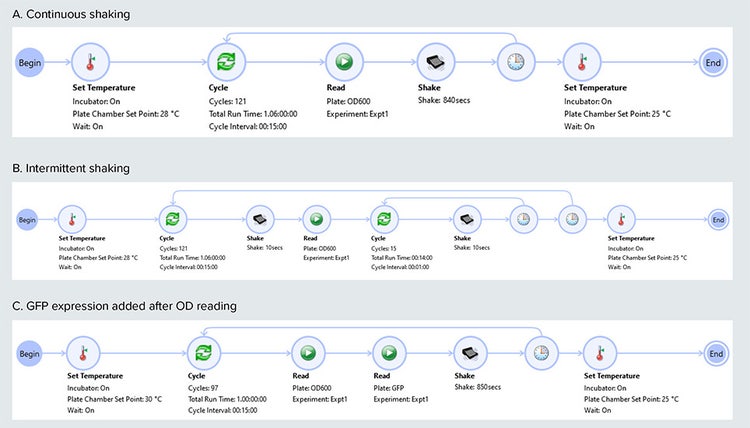
Figure 1. SoftMax Pro workflow protocols for continuous shaking (A) or intermittent shaking (B) with 10s agitation per minute and 50s idle time. Both types of kinetics were followed for 24h taking a read every 15 min. When GFP expression was followed, both in intermittent and continuous shaking, a fluorescence measurement was added after the absorbance reading (C). Shaking was done at 517 RPM with a 1.7mm shaking diameter.
Results
InBio.be tested four prokaryotic and three different eukaryotic species. All strains grew under continuous and intermittent shaking conditions. The shaking settings affected the microorganisms differently depending on the species, temperature, and growth medium. Here we show representative examples; further data is available upon request.
Prokaryotes A and B are aerobes and were grown at 28°C. Prokaryote A had similar Vmax values and growth curves under continuous and intermittent shaking (Fig. 2). Prokaryote B had a 30% higher Vmax value in continuous shaking conditions however the onset of growth was much faster with intermittent shaking (8 hours with continuous vs 4 hours with intermittent shaking) (Fig. 3). Of note, inoculation percentages were higher for the intermittent shaking plate. Prokaryote B showed a decreased lag phase and a smoother exponential phase with intermittent shaking. Both curves reached the same final OD.
A sample eukaryote data set is shown in Fig. 4. Continuous shaking resulted in a slightly higher Vmax (1.2-fold), but the curves were largely overlapping and followed the same growth phases. Eukaryote A is a GFP-expressing strain. Interestingly, the onset of GFP expression was earlier and showed an increase in Vmax by 1.2-fold with intermittent shaking conditions (Fig. 5) (note higher inoculation percentage as above). The increased GFP production early on could be due to a faster adaptation of the strain to intermittent shaking conditions.
Another interesting case was eukaryote strain C which exhibited growth in clumps. Under continuous shaking, this type of growth exhibited many artifacts and highly variable ‘zigzagging’ OD traces (Fig. 5). Such irregular OD values are very likely artifacts. Continuous shaking may promote clumping which may have affected the optical path and/or contributed to the formation of air bubbles if the solution was high in amphiphilic particles (similar to a soap solution). Under these conditions, it was impossible to calculate Vmax: the squared correlation coefficient (R2) for Vmax fit was between 0.56 and 0.92 for all replicates and the four different media tested under continuous shaking. Intermittent shaking significantly improved the stability of the signal, allowing the reliable calculation of the growth rates of the samples (for the four media tested, the mean R2 values for Vmax fit were 1.0, 0.99, 0.97,and 1.0).
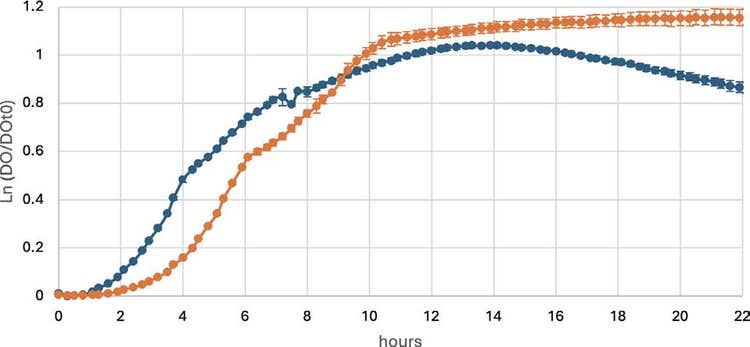
Figure 2. Growth curves of prokaryote A at 28°C, with continuous (orange) or intermittent (blue) shaking. Shown are the means of triplicate wells, with error bars representing standard deviation. Continuous: Mean Vmax = 3.751 mU/min, calculated using 8 points with mean R2 = 0.996; CV (Vmax) = 1.3%. Intermittent: Mean Vmax = 3.737 mU/min calculated using 8 points with mean R2 = 0.996; CV (Vmax) = 3.8%.
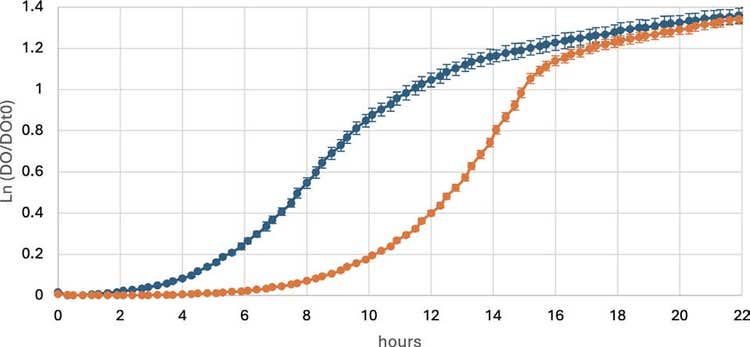
Figure 3. Growth curves of prokaryote B at 28°C with continuous (orange) or intermittent (blue) shaking. Shown are the means of triplicate wells, with error bars representing standard deviation. Continuous: Mean Vmax = 4.028 mU/min, calculated using 8 points with mean R2 = 0.998; CV (Vmax) = 1.6%. Intermittent: Mean Vmax = 3.135 mU/min calculated using 8 points with mean R2 = 0.993; CV (Vmax) = 3.1%.
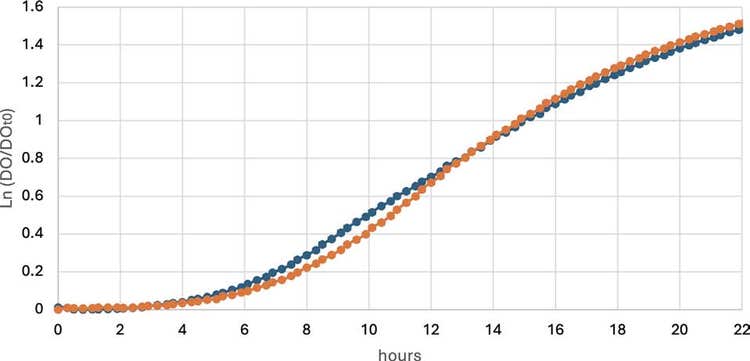
Figure 4. Growth curves of eukaryote A at 30°C with continuous (orange) or intermittent (blue) shaking. Shown are the means of triplicate wells, with error bars representing standard deviation. Continuous: Mean Vmax = 2.338 mU/min, calculated using 10 points with mean R2 = 1; CV (Vmax) = 0.6%. Intermittent: Mean Vmax = 1.926 mU/min calculated using 10 points with mean R2 = 0.999; CV (Vmax) = 0.5%.
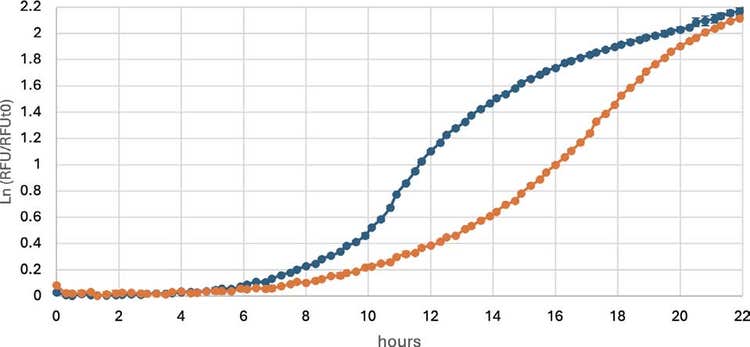
Figure 5. GFP expression in eukaryote A at 30°C with continuous (orange) or intermittent (blue) shaking. Shown are the means of triplicate wells, with error bars representing standard deviation. Continuous: Mean Vmax = 4.541 mU/min, calculated using 10 points with mean R2 = 0.997; CV (Vmax) = 0.6%. Intermittent: Mean Vmax = 5.469 mU/min calculated using 10 points with mean R2 = 0.997; CV (Vmax) = 2.3%.
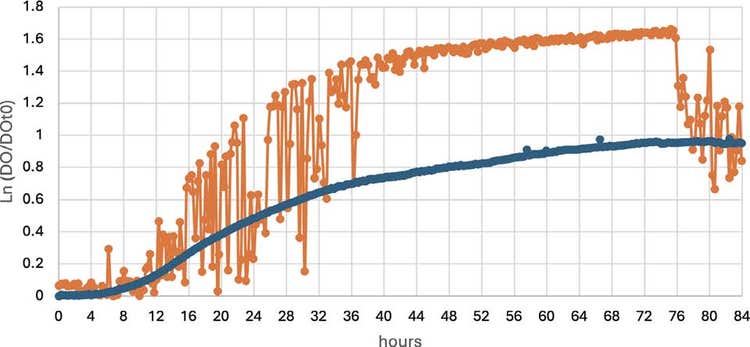
Figure 6. Growth curves of clump-forming eukaryote C grown at 25°C with continuous (orange) or intermittent (blue) shaking. Four different media were tested. Shown is one example out of a set of triplicate wells for one medium; similar results were obtained with other replicates and other media. Average data for continuous shaking was not considered due to high variability among triplicates (CV up to 154%); Vmax could not be reliably calculated due to artifacts. Vmax was calculated for intermittent shaking using 20 Vmax points: Mean Vmax = 0.612 mU/min, R = 1, CV = 3.6%.
Conclusion
We have demonstrated that different microorganism strains require different shaking conditions for optimal growth. Shaking intervals can also affect marker expression and modify the growth phases of the microorganism. Aerobic and fast-growing strains like prokaryote A may require more robust shaking, while slower-growing or more fragile strains like eukaryote A may grow faster with intermittent shaking. We advise customers to test their individual strains for the optimal shaking intervals.
With the easy-to-use SoftMax Pro software workflow editor, users can easily program a variety of shaking intervals using our SpectraMax iD series readers. With the advanced shaking upgrade on the SpectraMax iD3s and iD5e readers, customers can further adjust the RPM and shaking diameter to optimize the growth conditions for their strains, with robust shaking for long-term continuous shaking experiments. Additionally, SoftMax Pro software allows researchers to easily measure absorbance (OD600 values) for microbial growth and fluorescent marker expression in one workflow, with fully automated data analysis for added convenience.
References
- Duetz, 2007, Trends in Microbiology, doi: 10.1016/j.tim.2007.09.004
- Chung et al., 2020, Catalysis, doi: 10.3390/catal10040382
- Munna et al., 2014, SciePub, doi: 10.12691/ajmr-2-1-7