
Application Note
Intelligent time-lapse imaging to enhance live cell assay development
- Use pre-designed application modules or user-created custom modules for image analysis
- Decrease analysis times by up to 40X with parallel image processing
- Follow activity of fluorescently labeled and unlabeled cells over long time periods
Introduction
The ability to monitor responses in living cells over a specific period of time offers cell biologists several key advantages for assay development. For routine cellbased screening, time-course results can determine the correct time to read end-point assays. High content time-lapse imaging can also be used to characterize kinetics for multiple reactions at once, and to monitor cell proliferation or death.
MetaXpress® High Content Image Acquisition and Analysis Software (version 5.1 and higher) fully automates both the acquisition and analysis of timelapse imaging data. Analysis of the entire time series of images is performed using either pre-configured application modules or unique, user-designed custom modules that can be shared and utilized with MetaXpress® PowerCore™ High-Content Distributed Image Analysis Software. Trends and outliers are instantly identified via heat map visualization of the analyzed plate.
The following experiments were performed using the ImageXpress® Micro High-Content Imaging System with an environmental control chamber, which allowed live cells to be maintained over extended time periods within the instrument. In some cases, the system also performed scheduled fluidics addition or imaging of non-fluorescent cells with transmitted light.
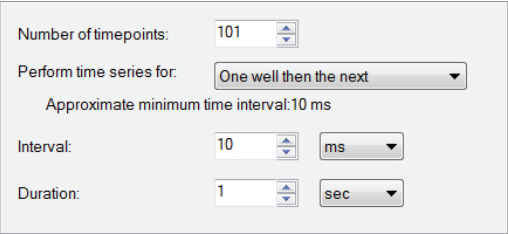
Fig. A
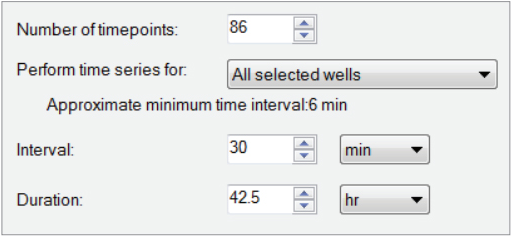
Fig. B
Measure neurite outgrowths as they develop
In this experiment, iPSC-derived neurons (Cellular Dynamics Intl.) with and without inhibitory treatments were seeded in a 96-well plate and imaged for 18 hours with transmitted light. The Neurite Outgrowth Application Module of MetaXpress Software was used to analyze images acquired over this time course. The resulting time vs. well data view generated using the time-lapse image analysis option (Figure 2) provides data visualization on a per-time point, per-well basis in a heat map format. As expected, untreated neurons produced multiple long outgrowths during overnight acquisition, while neurite outgrowth was stunted in staurosporinetreated cells (Figure 3).

Figure 2. Heat map allows quick evaluation of time-lapse responses. Change in neurite outgrowth visualized through a time vs. well heat map over 36 time points across 18 hours. Neurons in the wells of rows A05 and A06 wells were treated with 10 µm staurosporine. In all other wells, neurons were either untreated or treated with a growth factor only.

Figure 3. Neurite Outgrowth can be tracked over time in unlabeled cells. Left: Transmitted light images of unstained neurites with resulting neurite outgrowth image analysis mask (red). The untreated control cells (top) and 10 μm staurosporine-treated cells (bottom) after 36 time points show markedly different morphology. Right: Resulting data analyzed in AcuityXpress High Content Informatics Software shows median length of each cell’s neurite processes (y-axis) per time point (x-axis). A higher percentage of untreated cells demonstrated significant outgrowth lengths (top trace) vs. cells treated with the growth inhibitor staurosporine (bottom trace).
Track effect of treatments on cell proliferation in real time
Live cell time-lapse experiments provide more meaningful insight into the abnormal regulation of cell proliferation associated with cancer, subsequently aiding the development of treatments to inhibit uncontrolled division of cells.
Unstimulated U2OS GFP-expressing cells (Transfluor® Assay) were grown overnight and imaged every 30 minutes with a 10X Plan Fluor objective. Cells were then analyzed with a user-developed custom module for MetaXpress Software, which gave a robust cell count by first identifying cells via GFP in the cytoplasm and then filling in unstained area occupied by the nucleus, resulting in a robust cell count. The time-lapse analysis of two clones showed different starting cell counts and proliferation rates (Figure 4).

Figure 4. Determine cell proliferation rate in significant number of cells due to large field-of-view. Top: Time vs. well heat map data for GFP-expressing U2OS cells grown overnight. The clone in wells A04:A06 had higher cell counts than the clone in wells A07:A08. Bottom: A custom module accurately identified cells, even when flat-field (shading) correction was not used during image acquisition.
Characterize mechanism of cell death over multiple days
HeLa cells were stained for apoptosis with NucView-488 (green) for necrosis with Propidium Iodide (red) and also with Hoechst nuclear stain. Cells were dosed with peroxide, etoposide or left untreated and then imaged every 30 minutes over a 43-hour period (Figure 5, top). Images were analyzed using a custom module with the time-lapse image analysis option. The resulting well arrangement heat maps show cell viability or apoptosis at the end of the experiment (Figure 5, bottom).
Time-lapse profiles of some measured parameters including: overall viability, early apoptosis, late apoptosis and necrosis, were analyzed in AcuityXpress™ Software and are shown in Figure 6.

Figure 5. A visual snapshot of cell death results. Top: HeLa cell images over the course of the live cell experiment showed a range of results depending on treatment. Untreated control cells (left) had mostly viable nuclei (royal blue mask) after one hour (time point 2). At 25 hours (time point 50), many cells treated with etoposide (middle) were in early apoptosis (pink mask) and late apoptosis (white mask). Peroxide-treated cells (right) show mostly late apoptosis (white mask) with some suffering necrosis (purple mask) at 43 hours (time point 86). Bottom: Heat maps of data provide immediate visualization of cellular reactions to treatment with etoposide in rows D and E, or peroxide in rows F and G vs. untreated wells in rows B and C by the end of the experiment.

Figure 6. Time-lapse data plotted for 3 treatments. Time-lapse plots of control, peroxide-treated (H2O2) and etopisode-treated (Et) HeLa cells over a 43-hour period. Different mechanisms of cell death are evident with different treatments
Count beat rate in human cardiomyocytes
Cardiomyocytes in culture are able to form a beating syncytium which behaves similarly to native cardiomyocytes. Oscillation of calcium levels occurring with synchronized contractions of the cells can be monitored using a calcium-sensitive dye, and treatment-induced changes in the pattern of oscillation can be monitored.
iPSC-derived cardiomyocytes (Cellular Dynamics Intl.) were monitored for calcium fluctuations using the FLIPR® Calcium 6 Assay Kit dye and then imaged three times per second in time-lapse mode for a total of 100 timepoints. A two-step custom module with a simple threshold to measure calcium flux was written to analyze the data. The bright/dim intensity pattern displayed in the time vs. well heat map and in the image thumbnails indicates the beat rate.
Conclusion
Automatic evaluation of complex timelapse experiments requiring a controlled cell environment can easily be performed on the ImageXpress Micro System with an environmental control chamber. Individual images generated at each time point can then be processed and analyzed for immediate data visualization using MetaXpress and AcuityXpress Software. In addition, when extremely rapid generation of meaningful numbers from thousands of multi-wavelength images is needed, MetaXpress PowerCore Software can cut analysis time by up to 40 times, even when utilizing custom-designed analysis modules. These tools put efficient and accurate determination of many live cell biological processes within your reach.

Figure 7. Visualize cardiomyocyte beat pattern over time. Visualization of cardiomyocyte beat pattern data using time-lapse imaging. A plot of the time course reaction can be viewed in MetaXpress Image Analysis Software after the images are analyzed. The plot from a single well (shown in blue) can be viewed by clicking “Show Graph” (circled in red).
Learn more about ImageXpress Micro >>