
Application Note
An automated workflow for anti cancer drug toxicity evaluation using patient derived healthy intestinal organoids with suspension culture and AI enabled image analysis
- Reduce hands-on complexity by automating key steps in organoid culture, treatment, and monitoring.
- Improve consistency across assays by using a workflow designed for more uniform handling and easier scale-up.
- Get clearer toxicity answers by combining imaging with AI-based analysis to better detect meaningful phenotypic changes.
Oksana Sirenko, Prathyushakrishna Macha, Zhisong Tong, Owen McMillan, Nikki Carter | Molecular Devices, LLC
Introduction
Organoid technologies are transforming biomedical research by enabling the use of physiologically relevant three-dimensional human models. Organoids are increasingly important in drug discovery and are widely used for drug screening, toxicity assessment, and disease modeling. Their use continues to grow in both drug discovery and toxicity evaluation. Because organoids offer improved translational relevance compared to traditional 2D cell culture, human-derived organoids become a powerful tool for studying disease mechanisms, evaluating drug responses, and assessing toxicity in an environment that more closely mimics in vivo biology.
Despite these advantages, widespread adoption of organoids remains limited. Organoid culture workflows are labor intensive and prone to variability and extracting meaningful biological insights from complex imaging data remains a major challenge.
In this work, we present an automated workflow to evaluate the toxicity of anticancer compounds using healthy human intestinal organoids. The improved workflow utilizes suspension culture of organoids in a low percentage of Matrigel®, which reduces technical challenges and improves assay robustness, consistency, and scalability compared to traditional Matrigel dome cultures. The workflow uses IntestiCult™ Plus Organoid Growth Medium, which supports both growth and differentiation of intestinal organoids into more mature phenotypes, thereby increasing the relevance of the model for toxicity evaluation.
The imaging and analysis methodology was developed to evaluate toxicity effects through machine learning– assisted classification of phenotypic changes in organoids. Importantly, the combination of multiparametric imaging and machine learning–based image analysis provides a comprehensive and unbiased assessment of compound effects.
The automated process for compound testing integrates organoid culture, assay setup, imaging, and data analysis with machine learning–based evaluation of toxicity effects. This approach enables scalable and efficient assessment of compound toxicity in 3D human intestinal models.
Methods
Instruments
Organoid culture was automated using the CellXpress.ai® Automated Cell Culture System. Imaging was performed on the ImageXpress® HCS.ai High-Content Screening System, and image analysis was conducted using the IN Carta® Image Analysis Software.
Automated culture and monitoring of human duodenal organoids
A vial of human duodenal organoids (DP41N2, provided by Cardiff University) was thawed and processed according to the recommended protocol. Organoids were resuspended in the IntestiCult Organoid Growth Medium (OGM, STEMCELL Technologies, #06010) with 5% of growth factor–reduced Matrigel (Corning #356231). The organoid suspension was placed in a 96 deep-well reservoir and automatically seeded into flatbottom 96-well plates (Corning, Cat. No. 3603) using the CellXpress.ai system. Organoids were plated at a density of approximately 1,000 organoid fragments per well.
Following seeding, plates were incubated at 37 °C with 5% CO₂. On the first day of culture, organoids were maintained in OGM. Beginning on Day 2, the media was switched to IntestiCult Plus Organoid Growth Medium (STEMCELL Technologies, #1001677) to support continued growth and differentiation of organoids. Brightfield (transmitted light) imaging was performed using the imaging module of the CellXpress.ai system to monitor organoid growth and morphology over time. After 6 days in culture, organoids reached sufficient size with morphology observed to be more mature and differentiated.
Compound treatments were applied using a 7-point dilution range, 4-fold dilution series, starting from 100 µM concentration, except for afatinib, which started from 10 µM concentration (all Sigma compounds). Organoids were cultured with compounds for 72 hours.
Staining organoids
After compound treatment, organoids were stained for 1 hour with Hoechst (2 µg/mL), MitoTracker Orange (500 nM), and Calcein AM (1 µM) for live imaging; organoids were then fixed with 5% PFA and re-stained with AF488-conjugated phalloidin overnight (all Thermo Scientific dyes). After staining, imaging was performed using the ImageXpress HCS.ai High-Content Screening System to assess compound treatment effects.
Imaging organoids
Organoids were imaged with the ImageXpress HCS.ai system standard confocal option (60 µm pinhole) in three fluorescent channels: DAPI, FITC, and TRITC at 10X magnification. A 4X4 site pattern per well was acquired at 10X magnification to cover organoids positioned across the entire well. Z-stacks of 16 images were acquired at 8 µm intervals, covering a Z-range of 160 µm. Maximumprojection 2D images were used for analysis.
High-content image analysis
Image analysis was applied to 2D maximum-projection images using the IN Carta Image Analysis Software Custom Module Editor (CME) to create a multi-step protocol that defined organoids as “round objects” using the TRITC channel (mitochondrial stain). The number of organoids, average organoid area, and average organoid fluorescence intensities for Hoechst, Calcein AM, and MitoTracker Orange were measured using DAPI, FITC, and TRITC filter sets, respectively. Specifically, a Gaussian filter was first used to blur the Hoechst signal to facilitate organoid segmentation. Nuclei were then segmented and used to define cells. Cells were scored as positive or negative depending on the signal intensities for Calcein AM or MitoTracker Orange. Thresholds for positive and negative cell scoring were set empirically using control (untreated) samples and samples treated with a toxic compound. Cells scored positive for Calcein AM or MitoTracker Orange were defined as intact, or “live”. Positive and negative cells per organoid were counted, and the average area and average intensity of positive cells were measured. After analysis, concentration dependencies for different readouts were plotted using a four-parameter curve fit (for the 0.06–100 µM concentration range) to calculate IC50 values for compound toxicity effects. The SoftMaxPro® Software was used for curve fitting and IC50 calculations. A similar approach was used with images of fixed organoids where cells were scored as positive or negative using AF488-conjugated phalloidin stain.
Image analysis with machine learning
Organoid image analysis was performed using the IN Carta software, incorporating machine learning-based phenotypic classification through the Phenoglyphs module. A more detailed method description is presented in the Results section.
Results and discussion
Automated workflow for suspension culture of human intestinal organoids using the CellXpress.ai system
Typical workflows for organoid culture include plating organoids in Matrigel domes, which involves tedious steps for dome formation and passaging, as well as for compound treatment and staining, particularly when multi-well plate formats are used for screening applications.1 However, there is a growing trend toward utilizing organoid suspension cultures in media containing low concentrations of extracellular matrix (ECM), rather than embedding organoids in solid Matrigel.2,3 This approach reduces labor and cost while improving scalability, making it well suited for high-throughput workflows. The following protocol outlines the use of organoid suspension culture for compound testing and evaluation of toxicity effects.
Healthy patient-derived duodenal organoids were cultured in suspension with 5% Matrigel using the CellXpress.ai system (Figure 1) to automate key steps, including seeding, feeding, and monitoring. The workflow is shown in Figure 1A and is described in more detail in the Methods section. It includes several pre-configured steps that can be selected from a dropdown menu. The seeding step dispensed the organoid suspension into 96-well plates. Notably, suspension seeding presents fewer technical challenges than plating Matrigel domes into small wells, where domes often shift from the center. The incubation step allows organoids to settle before imaging or media addition and the feeding step supports periodic imaging and automated media exchange.
Organoids were initially plated from a vial containing approximately 100,000 small organoids and cultured in IntestiCult Organoid Growth Medium (Human) (OGM, STEMCELL Technologies) supplemented with 5% growth factor–reduced Matrigel.4 While robust growth was observed in OGM, organoids retained rounded morphological characteristics consistent with an immature phenotype (Figure 1B).
To promote maturation, starting on day 2 of culture we transitioned to IntestiCult Plus Organoid Growth Medium, which supports both expansion and differentiation of intestinal organoids and enables the development of more physiologically relevant models.5 Unlike standard organoid media formulations that primarily favor stem cell expansion, IntestiCult Plus promotes a balanced composition of cell types and induces crypt-like budding morphology.
Use of IntestiCult Plus medium resulted in organoids exhibiting irregular shapes and budding structures consistent with a more differentiated phenotype. Organoids were maintained in 96-well plate format, with each well containing approximately 100 organoids.
Brightfield (transmitted light) imaging was performed using the imaging module in the CellXpress.ai system to monitor organoid growth and morphology over time. After 6 days in culture, organoids reached sufficient size and displayed morphological changes, including irregular shapes and budding structures, indicative of more mature phenotypes (Figure 2).
Assay setup and compound treatment
Organoids were plated into 96-well plate formats, with each well containing approximately 100 organoids. Notably, the distribution of organoids across wells was more uniform than typically observed with dome cultures, resulting in less than 20% variance in organoid number per well. After 7 days of culture, organoids were treated with a panel of anticancer compounds associated with intestinal toxicity.6,8
Compound addition was a 7-point concentration range (4-fold dilutions). Organoids were exposed to compounds for 72 hours, allowing concentration-dependent phenotypic responses to develop.
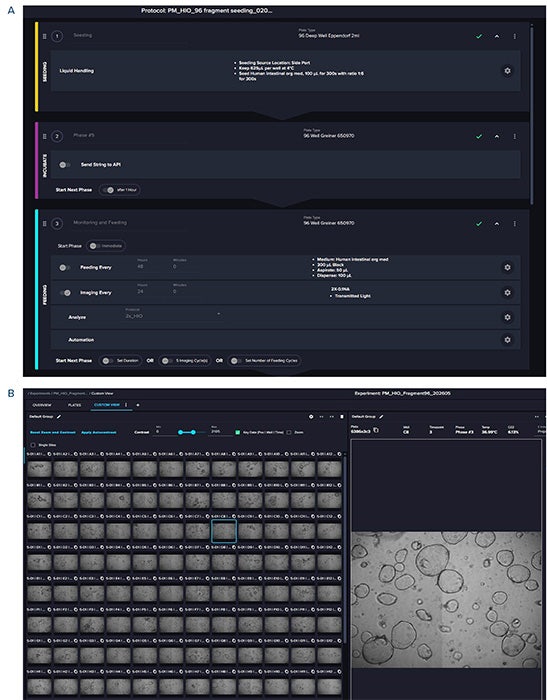
Figure 1. Protocol for automated organoid seeding and monitoring using the CellXpress.ai system. A. The protocol includes the following steps: a seeding step that dispenses the organoid mixture into 96-well plates from a deep-well reservoir; an incubation step that introduces a pause to allow organoids to settle; and a feeding and imaging step that enables media exchange and transmitted light imaging. B. Screenshot from the data review page shows images of plated organoids (day 2) acquired at 4X magnification.
Multiparametric imaging and phenotypic readouts
Following drug treatment, organoids were analyzed using both live and fixed staining approaches. Live-cell staining included Hoechst to label nuclei, Calcein AM to assess cell viability, and MitoTracker Orange to measure mitochondrial activity. In addition, samples were fixed and stained with a panel of markers for nuclei, cytoskeleton, tight junctions, and mitochondria. Samples were subsequently re-stained with AF488-conjugated phalloidin to visualize the actin cytoskeleton. This multiparametric imaging strategy enabled simultaneous evaluation of morphology, viability, mitochondrial function, and structural organization (Figure 2).
Dose-dependent effects on organoid morphology and cell viability were evaluated using automated confocal high-content imaging with the ImageXpress HCS.ai system. Z-stacks of confocal images were compressed into maximum projection images, which were tiled across multiple sites to cover the entire well area. Image tiling and generation of maximum projections during acquisition were enabled using the MetaXpress® Acquire software, thereby reducing the time required for downstream analysis.
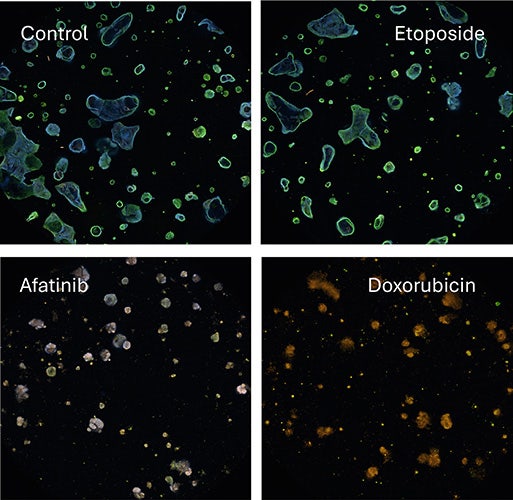
Figure 2. Representative images of untreated and drug-treated organoids. Confocal images show intact organoids under control conditions and phenotypic changes following treatment with compounds such as etoposide (50 µM), afatinib (10 µM), and doxorubicin (10 µM). These phenotypic changes include a decrease in organoid size, reduced actin signal intensity and organization, and compromised organoid integrity. Etoposide treatment did not result in notable phenotypic changes.
Image analysis and phenotypic classification of morphological changes
After imaging, maximum projection images were analyzed using the CME within the IN Carta software. A CME protocol was developed using a sequence of image processing and analysis steps that identified organoids as round objects, followed by the detection of individual cells based on nuclear staining. Cells were then classified as positive or negative for specific markers based on the intensity of cytoskeletal or mitochondrial signals.
Multiple measurements were extracted from both organoids and individual cells, including size, intensity, and intensity distributions across different fluorescent channels. In addition, the number of live and dead (intact and damaged) cells within each organoid was quantified. The CME analysis protocol extracted a comprehensive panel of quantitative features per organoid, with approximately 110 features measured. These included morphological descriptors, intensity metrics across three fluorescent channels, textural features, and spatial distribution patterns. The extraction of these multiple features enabled multidimensional phenotypic profiling of organoid populations.
We observed multiple compound-induced effects on organoid phenotypes, including decreases in average organoid area, reductions in the number of live cells, and loss of Hoechst staining intensity or cytoskeletal integrity. Selection of individual measurements for dose–response analysis typically introduces bias in evaluating compound effects, while multiparametric analysis requires advanced statistical methods. In contrast, machine learning tools provide an unbiased and comprehensive approach by automatically scoring organoids based on similarities across phenotypic measurements.
Machine learning-assisted evaluation of compound effects
Images were analyzed using the machine learning capabilities within the IN Carta software Phenoglyph module to classify organoids based on phenotypic similarities and differences. Classification was performed using a combination of unsupervised and supervised machine-learning approaches.
Unsupervised clustering grouped organoids into multiple phenotypic clusters based on feature similarity, which were subsequently curated into biologically relevant categories using user-defined criteria. These clusters were then refined using supervised learning to classify organoids into two biologically meaningful categories: “intact” and “damaged.” The organoid classes were consolidated into these two categories, and supervised machine learning trained the model to classify organoids accordingly (Figure 3). The number or percentage of intact and damaged organoids was then used to evaluate compound toxicity effects (Table 1).
A panel of anticancer drugs was tested, and IC50 values were determined using machine learning–based classification of “intact” and “damaged” organoid phenotypes. This classification enabled evaluation of compound effects in a concentration-dependent manner. Unlike single-parameter readouts, this approach incorporates a broad morphological context, providing deeper insights into phenotypic changes.
In summary, we demonstrate a fully automated workflow for evaluating compound effects using healthy duodenal organoids. This approach enables AI-driven phenotypic profiling for assessing toxicity-induced effects in organoid models.
Quantitative analysis of drug responses
Drug responses were quantified using the proportion and number of intact organoids, and dose–response curves were generated to calculate IC50 values. Afatinib treatment resulted in decreased organoid size and reduced viability of healthy patient-derived duodenal organoids, with IC50 values of 21.1 µM (based on intact organoid count) and 24.3 µM (based on percentage of intact organoids). Doxorubicin showed IC50 values of 12.1 µM and 7.2 µM, respectively. Etoposide did not cause significant phenotypic changes, whereas taxol induced a modest decrease in intact organoids, with EC50 values of 13.3 µM and 14.9 µM based on intact organoid count and percentage, respectively. These results demonstrate clear, compound-specific effects on organoid integrity and viability (Table 1).
Interestingly, four-parameter curve fitting and EC50 determination were more robust when based on classification measurements than when using live/dead cell counts, organoid area, marker intensity, or other individual readouts obtained via high-content imaging (Table 1).
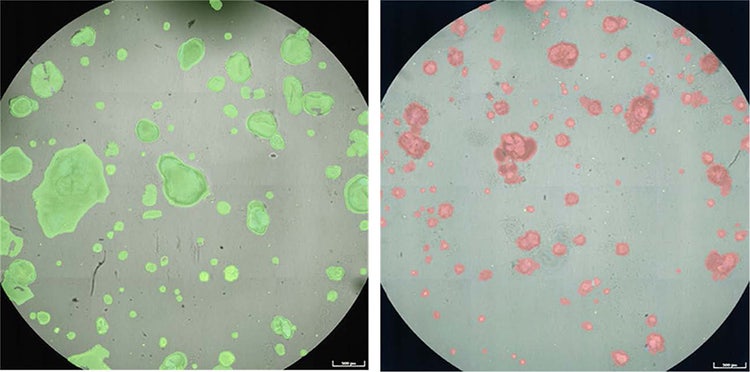
Figure 3. Machine-learning organoid classification. After training and applying the analysis model, the software classified organoids as “intact” (green mask) or “damaged” (red mask). The control sample is shown on the left, and the sample treated with doxorubicin is shown on the right. The percentage or number of intact organoids was then used to assess compound effects. This approach enabled quantitative evaluation of compound responses based on overall phenotypes rather than individual markers.
Table 1. Compounds caused dose-dependent deterioration of organoids, including a decrease in size and a reduction in actin integrity. Multiplexed phenotypic characterization of organoids was performed by classifying them as “intact” or “damaged” using machine learning. The table shows EC50 values for decreases in both the number and percentage of intact organoids. Live cell counts are presented in the right column.
Conclusion
This study demonstrates an automated workflow for evaluating compound-induced toxicity effects in human duodenal organoids that addresses key challenges in organoid-based assays, including labor-intensive handling, workflow variability, and limited scalability. By combining suspension culture with automated culture, treatment, staining, and imaging, the workflow supports more consistent execution in a 96-well format while improving the physiological relevance of the model through organoid differentiation.
In addition, the use of multiparametric imaging and AI-based phenotypic classification enabled a more comprehensive assessment of compound effects than single-readout approaches alone. Together, these capabilities provide a scalable and efficient strategy for toxicity evaluation in human organoid models, with the potential to improve the quality and interpretability of phenotypic drug response data.
References
- Sato, T. et al. (2009) Single Lgr5 stem cells build crypt villus structures in vitro without a mesenchymal niche. Nature 459, 262–265
- Hirokawa, Y. et al. (2021). Low-viscosity matrix suspension culture enables scalable analysis of patient-derived organoids and tumoroids from the large intestine. Communications Biology, 4, 1067.
- STEMCELL Technologies protocol (2026). Scale-Up and Scale-Down of Intestinal Organoids in Dilute Matrigel Suspension Culture
- STEMCELL Technologies. IntestiCult™ Organoid Growth Medium (Human). Vancouver, Canada: STEMCELL Technologies; Catalog #06010. https://www.stemcell.com/products/intesticult-organoid-growth-medium-human.html
- STEMCELL Technologies. IntestiCult™ Plus Organoid Growth Medium (Human). Vancouver, Canada: STEMCELL Technologies; Catalog #100 1677. https://www.stemcell.com/products/intesticult-plus-organoid-growth-media.html
- Dahlgren, D., Sjöblom, M., Hellström, P. M., & Lennernäs, H. (2021). Chemotherapeutics-induced intestinal mucositis: Pathophysiology and potential treatment strategies. Frontiers in Pharmacology, 12, 681417.
- Hopkins, A. M. et al. Risk factors for severe diarrhea with afatinib treatment of non-small cell lung cancer: A pooled analysis of clinical trials. Cancers 10, 384 (2018).
- Daniels, J. A., et al. (2008). Gastrointestinal tract epithelial changes associated with taxanes: Marker of drug toxicity versus effect. American Journal of Surgical Pathology, 32, 473–477.