
Application Note
L-malic acid measurement in wines using the SpectraMax Plus 384 Microplate Reader
- Improved throughput relative to traditional single-tube assays
- Direct quantitation of analytes in wine samples
- Automatic calculation of results with SoftMax Pro Software
Introduction
Analysis of malic acid, residual sugar, volatile acidity and ammonia is very important for quality control during wine production. Enzymatic assays carried out in microplate format are quantitative and help achieve high throughput with respect to time and labor. These tests involved enzymatic conversion of the analytes to give NADH as a by-product. Measuring NADH production by measuring absorbance at 340 nm allows direct quantitation of the analytes in wine samples. Here we describe the use of Molecular Devices SpectraMax® Plus 384 Microplate Reader and SoftMax® Pro Software to efficiently collect and analyze data for the enzymatic determination of residual sugar in wine.
Some of the unique features of the SpectraMax Plus 384 Microplate Reader are:
- Wavelength Range: 190–1000 nm in 1-nm increments, with no need for separate filters
- Read Speed: 96 wells: 9 Seconds
384 wells: 29 Seconds - Temperature: 4°C above ambient to 45°C
- Cuvette port: Holds standard cuvettes and 12 x 75 mm test tubes
- OD range: 0–4 OD
Malic acid determination (MAD) in wine by enzymatic method
Enzymatic Reactions:
(1) L-(-)-Malic adic + NAD+

(2) Oxaloacetate + L-Glutamate

LMDH: L-Malic Dehydrogenase
GOT: Glutamate-Oxaloacetate Transaminase
Reaction dynamics
The equilibrium reaction (Reaction 1 above) is favored in the direction of the reactants (L-malic acid and NAD+ ). The formation of reactants in this reaction is prevented by coupling it with the second reaction, which favors the formation of products (L-aspartate and a-ketoglutarate). Since the formation of NADH is stoichiometrically related to the oxidation of L-malic acid, measurements for L-malic acid can be determined by the absorbance of NADH at 340 nm.
PathCheck Sensor
The PathCheck Sensor is a temperature independent feature from Molecular Devices that measures the optical pathlength of samples in microplate wells. It is an innovative way of normalizing the absorbance reading in a microplate well to that of a 1-cm cuvette..
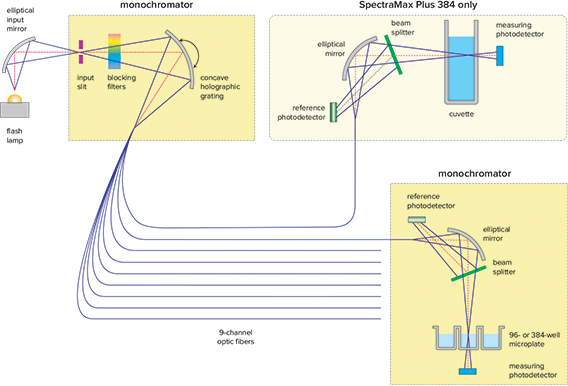
Figure 1. SpectraMax® Plus 384 optics.
Beer-Lambert Law states that
Absorbance = E * C * L
where
E = absorptivity (extinction coefficient)
C = concentration
= pathlength
In case of a cuvette, the optical path is horizontal, hence the pathlength is fixed and is equal to 1 cm. But in case of a microplate, the optical path is vertical. So, the pathlength depends on the volume of the sample (Figure 2). The PathCheck Sensor corrects for this discrepancy.
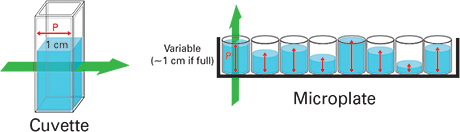
Figure 2. Pathlength in a cuvette and a microplate are different.
SoftMax Pro Software
The software controls the instrument, collects the data, and provides complete data analysis. Customized protocols with appropriate instrument settings and calculations can be pre-written and saved. The end user can conveniently open a preconfigured protocol and obtain complete results and analysis with no protocol setup time.
Materials
- SpectraMax Plus 384 Microplate Reader(Molecular Devices cat. #PLUS 384)
- UV transparent 96-well microplates for addition of reagents (Costar cat.# 3635)
- Transferpette micropipette (Drummond Scientific cat. #2704174, 2705402, 2705412, 2704180; Drummond Digital Microdispenser cat.# 3-000-510)
- Microtips for the micropipettes (Eppendorf cat. #epT.I.P.S.; Reloads cat. #022491539, 022491512, 022491547)
- Centrifuge for microfuge tubes (Eppendorf cat. #5424)
- Microfuge tubes 1.5 mL capacity (Eppendorf cat. #022364111, 022363557, 022363514, 2236357-3)
- L-Malic Dehydrogenase 25 mg/5 mL (LMDH, Roche cat. #10127914001)
- Glutamate-Oxaloacetate Transaminase 2 mg/mL (GOT, Roche cat. #10105546001)
- ß-Nicotinamide-Adenine Dinucleotide (NAD, Roche cat. #10127990001)
- Glycyl-glycine (Sigma cat. #G1002-100G)
- L-Glutamic Acid(Sigma cat. #G2128-500G)
- 2.5 N KOH(Fisher Scientific cat. #P251-500)

Figure 3. Malic acid determination (MAD) in wine
Table 1. Preparation of L-Malic acid standards.
Methods
Preparation of L-Malic acid standards
The reagents were stirred until dissolved. If standards produced a standard curve with coefficient of determination (R) = 1.000, they were stored in 1.5-mL freeze tubes at -4°C. Reagents may not give an ideal standard curve if they are too old
Preparation of buffer solution
To 70 mL deionized (DI) H2O 15.0 g glycylglycin; 30.0 g L-glutamic acid; 67 mL of 2.5 N KOH were added. The pH was adjusted to 10.0 with 2.5 N KOH. Volume of this solution was adjusted to 500 mL with a volumetric flask. The buffer was stored at 4°C
Step 1: Blanks, standards and samples were run in duplicates (Table 2).
Table 2. Preparation of blank, standard, and samples.
Step 2: L-Malic acid standards were removed from the freezer and allowed to warm to room temperature.
Step 3: The amount of buffer necessary to analyze standards and samples was measured out into a dedicated “MAD” beaker and warmed to room temperature. This step is necessary for achieving an ideal coefficient of determination.
Step 4: GOT and NAD were added to the buffer according to Table 3. GOT and NAD were mixed into buffer thoroughly, but gently to avoid denaturing the enzyme.
Table 3. Calculation of GOT and NAD needed to be added to reaction buffer.
Step 5: 300 µL of buffer was dispensed into each well using the 300 µL multichannel pipette.
Step 6: 5 µL of DI H2O, standard, or sample was dispensed into the appropriate wells.
Step 7: The reagents were mixed by pipetting up and down (trituration).
Step 8: The plate was mixed by vortexing for 30 seconds, followed by taking the absorbance reading on the microplate reader, denoted as ‘Initial’.
Step 9: Immediately after the initial read, 5 µL of LMDH was dispensed into each well using the 1–20 µL multichannel pipette.
Step 10: The plate was mixed by vortexing for 30 seconds and incubated at room temperature for 21 minutes.
Step 11: After 21 minutes of incubation a ‘Final’ reading was taken on the microplate reader with the same instrument settings.
Instrument setup
The instrument was programmed through the SoftMax Pro Software. The settings were selected in the plate section of the software (Figure 4).
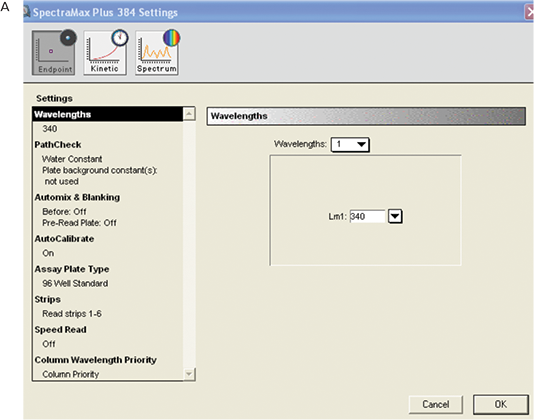
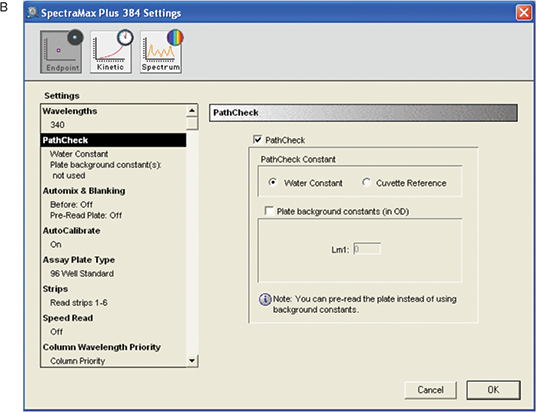
Figure 4. Instrument settings for MAD assay. A: Overall settings B: PathCheck settings.
The reading type was endpoint.
The wavelength was set at 340 nm by typing the appropriate number in the wavelength window.
“PathCheck” option with water constant was selected. The reaction took place in an aqueous environment, so the water constant included in the firmware of the instrument was used.
Automixing was not selected as the mixing was done externally on a plate shaker. With autocalibration, the instrument calibrated itself for the selected wavelength.
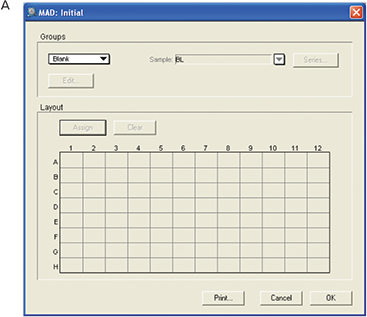
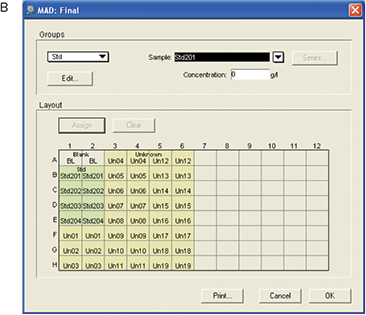
Figure 5. Template setup for MAD assay. For the initial plate, no template was set up. For the final plate blank, standards and unknown samples were assigned.
Appropriate plate format and wells to be read were selected.
Two identical plate sections were created. The initial plate section involved reading the plate with all the reagents but no enzyme. The final plate section was the actual reaction with the enzyme. The optical density readings from the initial plate section were subtracted from the optical density readings of the final plate section through reduction settings (Figure 6).
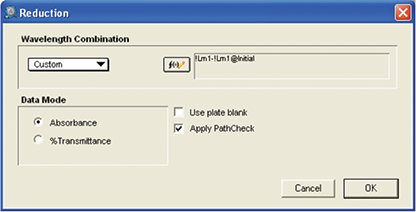
Figure 6. Reduction setup for MAD Assay. Reduction setup showing custom formula being used for the subtracting optical density of each well in the initial plate from the optical density of the same well in the final plate. PathCheck values were applied for the calculation.
Results
The experiment was performed as described in the Materials and Methods section. A baseline reading was taken with the plate containing reaction mixture except the enzyme (Figure 7, Panel A).After adding the enzyme to reaction mixture the plate was incubated for 21 minutes at room temperature and a final reading was taken (Figure 7, Panel B).
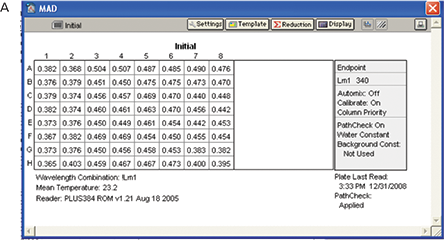
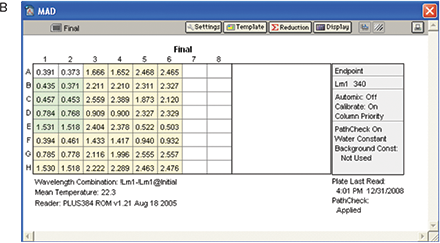
Figure 7. Results for MAD assay. Plate read with all the reagents and no enzyme (A) and plate read after addition of enzyme and incubation (B).
SoftMax Pro Software automatically calculated mean, standard deviation and %CV for the standard, and tabulated them in a group section (Figure 8).

Figure 8. Calculations for standards Standards group section with mean, standard deviation, and %CV calculations.
Standard curve
A standard curve was created using information from group section “Std” with concentration on the x-axis and mean OD value of the replicates on the y-axis. Standard deviation was used to denote the error bars, while a linear curve fit was assigned to the plot. The standard curve was used for determining the L-malic acid concentration in wine samples denoted as “Unknown” (Figure 9).
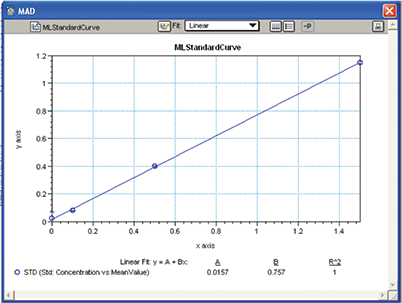
Figure 9. MAD assay standard curve. A Standard curve was plotted with linear curve fit and used to derive the concentration of malic acid in wine samples.
Determination of L-malic acid concentration in wine samples
A group section designated as “Unknown” was formed as per the assignment of wells with wine samples in the template section (Figure 10).
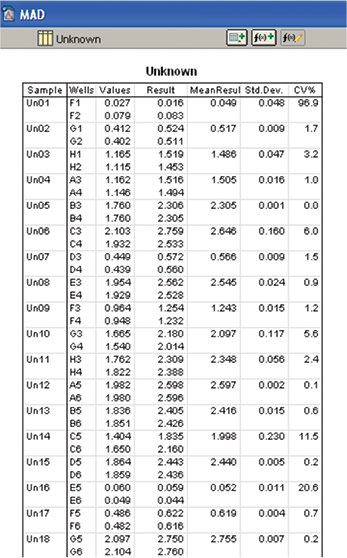
Figure 10. Calculation of malic acid concentration in wine samples. Malic acid concentration in wine samples was calculated using the standard curve.
Malic acid in each sample was calculated by the software using the standard curve for interpolation (Figure 11).

Figure 11. Custom formula for interpolation of standard curve. Formula for the column “Result” in the “Unknown” group table that automatically calculated malic acid in wine samples by interpolation from the standard curve.
Conclusion
Molecular Devices SpectraMax Plus 384 Microplate Reader is a good choice for running enzymatic quantitative measurement of L-Malic acid in wines and can be extended to similar assays, including ammonia and volatile acidity measurement.
It is cost and time effective.
Tunability and PathCheck Sensor features of the SpectraMax Plus 384 Microplate Reader aid in achieving higher precision and accuracy.
SoftMax Pro Software is a convenient tool for analysis and calculation of complicated and large data sets. It offers pre-written, ready-to-use protocols, custom formulas and appropriate graphing options.
Other Molecular Devices readers with absorbance detection mode, e.g. the SpectraMax i3x Multi-Mode Microplate Reader, may also be used for this application.
For increased throughput requirements, Molecular Devices StakMax® Microplate Handling System integrates with SpectraMax readers and enables automated processing of batches of 20, 40, or 50 microplates.