
Cell Counter
At the Cell Counter: HEK293-GFP Cells
Human Embryonic Kidney 293 cells, also known as HEK293, 293 cells, or even as HEK cells, are a cell line derived from human embryonic kidney. In the early 1970’s, Alex van der Eb isolated these cells in his laboratory at the University of Leiden, Holland, and another member of his lab transformed them by adenovirus, giving rise to the cell line used today. HEK293 cells are easy to grow and transfect, so they have been used extensively in transfection-based experiments, protein expression, and vaccine production. We imaged HEK293 cells lentivirally transformed with Green Fluorescent Protein (GFP; GenTarget Inc.) to showcase analysis of cell confluence on the SpectraMax MiniMax 300 Imaging Cytometer.
View StainFree Cell Detection Webinar
Download StainFree Cell Detection Application Note
Download eBook: Count Cells Like a Pro
Figure 1: StainFree identification of HEK293-GFP cells
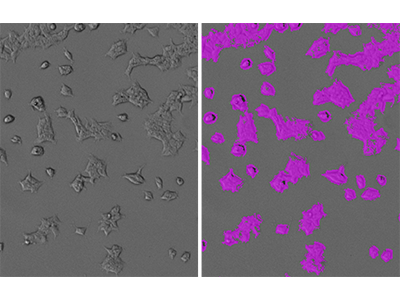
HEK293-GFP cells were imaged using the SpectraMax i3 MiniMax 300 Imaging Cytometer, and cells were identified using a custom field analysis setting. Shown on the left is the original transmitted light image, and on the right is the same image with purple masks indicating confluent areas identified by the software.
Figure 2: Defining cellular and background areas
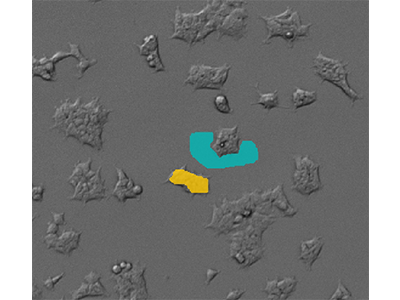
Use of drawing tools in SoftMax Pro Software to define cellular (yellow) and background (blue) areas of the images.
Figure 3: HEK293-GFP cells imaged on the MiniMax cytometer
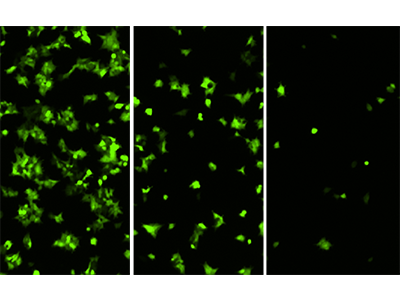
HEK293-GFP cells seeded at 20000, 5000, and 1250 cells per well and imaged in the green fluorescence channel of the MiniMax cytometer.
Figure 4: StainFree vs. fluorescence analysis
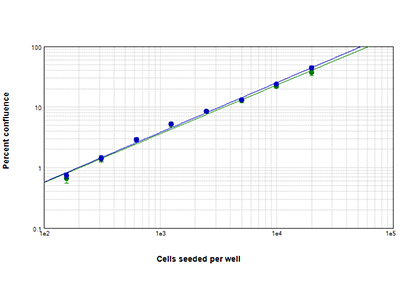
Comparison of confluent areas measured with StainFree analysis (blue circles) and fluorescence (green circles) analysis. StainFree percent confluence agrees almost perfectly with fluorescence-analyzed confluence.
Tip 1:
Sometimes cells are too clumpy to be counted individually. In these cases, the Field Analysis setting in SoftMax Pro Software can be used to find areas covered by cells, or percent confluence. StainFree analysis can be used for cells imaged in the TL channel. For some cell types, a predefined Cells setting in the software will identify cell-covered areas accurately and automatically. For HEK293, this predefined setting works reasonably well and can be used to estimate confluence for quality control purposes.
Tip 2:
If slightly more precise estimates of confluence are needed, a custom, user-defined setting may be the way to go. One key to getting accurate measurements of cell confluence is to draw with the Background tool on some areas that are very close to, but outside of, the borders of confluent areas. This helps minimize the amount of area bordering the cells that is counted as cell-covered area.
HEK293-GFP Cells Analysis Toolkit
- SpectraMax ® i3 Multi-Mode Microplate Detection Platform
- SpectraMax ® MiniMax™ 300 Imaging Cytometer
- SoftMax ® Pro Software
Instrument Settings
Analysis type: Field Analysis
Wavelength for finding confluent areas: TL or 541
About StainFree Cell Detection Technology
Imaging cell-based assays typically requires the use of fluorescent probes that can be toxic to living cells or may only function in fixed cells. A label-free method for analyzing cell counts and cell confluence enables researchers to quantitatively monitor cell proliferation and health without time-consuming workflows that may disrupt cell viability.
The SpectraMax i3 Multi-Mode Microplate Platform with MiniMax 300 Imaging Cytometer uses unique, patent-pending StainFree Cell Detection Technology that allows you to perform cell proliferation, cytotoxicity, and other assays without nuclear stains like DAPI, which intercalates with DNA, or live cell dyes that are actually toxic to cells in the long term.