
Application Note
Phenotypic characterization of anti-cancer drug effects using automated imaging
- Relevance of compounds identified
- Increased drug discovery success and productivity
- Translational biomarkers for phenotypic screening
- Cytotoxic effects of live and fixed cell staining protocols
Introduction
Matthew Hammer and Oksana Sirenko | Applications Scientists | Molecular Devices
Discovery and evaluation of anti-cancer therapies is an active area of research that includes development of cell-based models, screening for novel drugs, comparison of drug efficacy, and understanding the mechanisms of action. In contrast to target-based drug discovery, (testing compounds that modulate the activity of a specific target i.e. purified receptor or enzyme), phenotypic drug discovery has been shown to produce a greater number of first-in-class drugs with novel mechanisms of action1-3. Phenotypic drug discovery is based on testing compounds in cell-based disease models to identify drugs that cause a desirable change in phenotype2, such as cell death, inhibition of proliferation, or apoptosis. The increasing interest in phenotypic screening and multi-parameter readouts requires increased complexity of cell-based assays. Automated imaging enables simultaneous monitoring of multiple readouts and is an important tool for phenotypic drug discovery4. Information about cellular and subcellular effects of compound treatment, cytotoxicity, or inhibition of biological pathways provides deeper insight into the mechanisms of action of prospective therapeutics.
Automated cellular imaging is an efficient method for analyzing the cellular effects of anti-cancer compounds. Here we demonstrate how the ImageXpress® Nano Automated Imaging System along with the CellReporterXpress Automated Imaging and Analysis Software simplifies the analysis of anti-cancer compound treatment on cell proliferation, viability, and cell morphology. We developed imaging and analysis methods that provide tools for characterization of multiple phenotypes including viability markers, characterization of cell shape, cell adhesion and spreading, nuclear condensation, cytoskeleton integrity, and mitochondria potential.
Methods
To monitor the effects of anti-cancer compounds on cancer cells, HeLa cells were plated at a low density (1,250 cells per well) in a 384-well black, clear bottom microplate, and incubated at 37°C, 5% CO2 for 24 hours. The cells were then treated with anti-cancer compound solutions in a 1:3 dilution format for 48 hours. Compound treatments were performed in quadruplicates. The highest concentration of compounds were as follows: staurosporine (10 μM), mitomycin C (300 μM), paclitaxel (30 μM), etoposide (300 μM), and doxorubicin (100 μM).
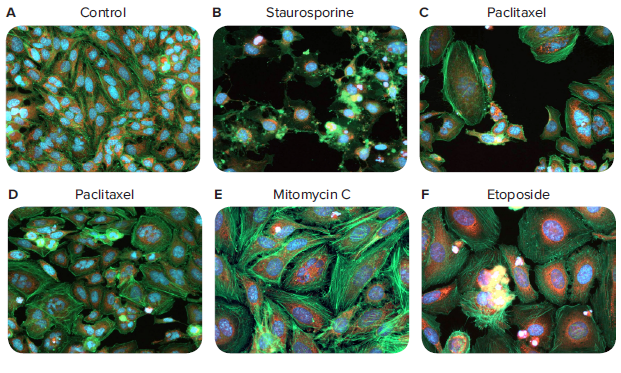
Figure 1. 40x images of HeLa cells stained with AlexaFluor488 phalloidin. Representative images show phenotypic changes of HeLa cells in response to compound treatments. Images were acquired with the ImageXpress Nano system and CellReporterXpress software using a 40x Plan Fluor objective. Note the following changes in phenotypes: apoptotic nuclei, cell detachment, changes in cell area and intensities of phalloidin stain, changes in nuclear number and shape. Drug concentrations for each compound are as follows: B) staurosporine (0.12 μM), C) paclitaxel (5.1 x 10⁻⁴ μM), D) paclitaxel (1.7 x 10⁻⁴ μM), E) mitomycin C (0.41 μM), and F) etoposide (3.7 μM).
After 48 hours of compound treatment, cells were stained with a combination of three dyes: Hoechst, Calcein AM, and MitoTracker Orange. A 2x staining solution was added directly to the media. The final concentrations of stains in all wells were 6.75 μM Hoechst 33342, 0.5 μM MitoTracker Orange, and 1.25 μM Calcein AM (Life Technologies, or EarlyToxTM Live Cell Assay Kit). The cells were incubated with staining solution at 37°C, 5% CO2 for 30 minutes. Live cells were imaged and analyzed with the ImageXpress Nano instrument and CellReporterXpress software. The cells were analyzed with two Cell Scoring modules, one using FITC as a marker to quantitate the number of Calcein AM positive cells, and the other using TRITC as the marker for analyzing cells positive for mitochondrial stain.
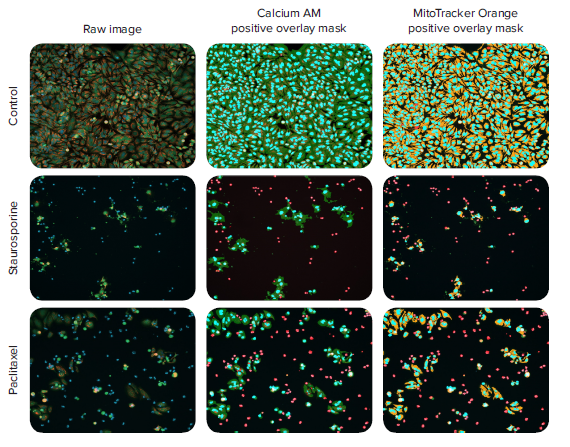
Figure 2. 10x images and the software analysis masks for detection of Calcein AM and MitoTracker Orange stained HeLa cells. HeLa cells were treated with anti-cancer compounds for 48 hours, and then stained with a nuclear stain (Hoechst 33342), live cell stain (calcein AM), and mitochondrial stain (MitoTracker Orange). The cells were imaged with the DAPI, FITC, and TRITC channels using the ImageXpress Nano system with a 10x Plan Fluor objective. The images (left) are labeled with nuclei (blue), calcein AM stained live cell marker (green), and mitochondria (orange). Images were analyzed with CellReporterXpress software using the Cell Scoring analysis modules optimized for the quantitation of calcein AM positive cells (middle) and MitoTracker Orange positive cells (right). The resulting analysis masks are shown (light blue = nuclei, red = dead cells, green = live cells, orange = mitochondria). The concentration of staurosporine is 0.370 μM and paclitaxel concentration is 0.00457 μM.
For assessment of additional markers, cells were fixed with a 4% formaldehyde solution, and subsequently washed twice with PBS (Cellgro). Post fixation, the cells were blocked and permeabilized with permeabilization buffer (DPBS + 0.01% saponin + 1% FBS) for 45 minutes. AlexaFluor® 488 (AF488) labeled phalloidin was diluted in the permeabilization buffer (1:50), and added to cells for two hours at 37°C. The cells were washed with PBS, imaged and analyzed using a Cell Scoring module optimized to quantitate cells that contained AF488 stained cytoskeleton.
Quantitation of phenotypic effects with automated imaging and analysis
A typical automated cell-based assay workflow includes plating cells, treatment with compounds, and automated imaging. Images analyzed by software allows for the derivation of multiple readouts that characterize the effects of compounds on cell morphology. For multi-parameter assays, Calcein AM can be used to define the number of live cells, characterize cell spreading, and cell morphology. Nuclear dyes are used to assess cell count and proliferation or characterize apoptosis, nuclear intensity and shape. MitoTracker dye can be used to define mitochondria integrity or potential. Cells can be imaged live, and then they can be fixed and stained with additional reagents (e.g. phalloidin) to provide information about cytoskeleton or other readouts.
Images were acquired with a 10x Plan Fluor objective, using standard DAPI, FITC, and TRITC filter sets, with the ImageXpress Nano system. One field of view with this objective accurately captured up to 2,400 cells in the untreated control samples, enabling a statistically relevant number of cells. The CellReporterXpress software streamlines the production of assay results with the ability to perform simultaneous image acquisition and analysis with preconfigured analysis modules. Images were analyzed during acquisition using preconfigured Cell Scoring analysis module. Cell Scoring was optimized for analyzing cell viability, mitochondrial health, or cytoskeleton integrity. A Cell Count analysis module was optimized for analyzing nuclei. The modules generated multiple readouts including, but not limited to, total cell counts, the quantification of marker-specific cell numbers, intensity and integrated intensity values for the markers, total and average cell area, and nuclei characterization including average areas and intensities.
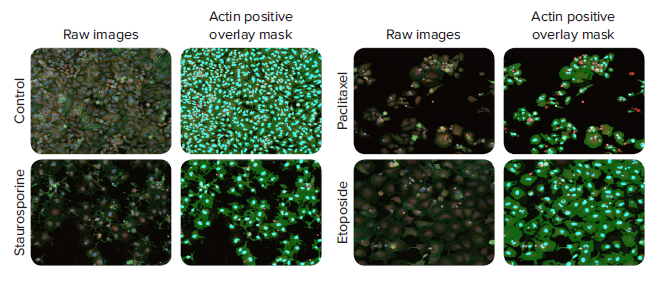
Figure 3. Representative images and analysis masks of HeLa cells treated with anti-cancer compounds and stained with AF488-Phalloidin. Images were taken with a 10X Plan Fluor objective using the ImageXpress Nano system. The Cell Scoring analysis module, optimized to find cells with intact actin networks, was performed simultaneously with image acquisition in CellReporterXpress software. 10x images with (25% of zoomed images are displayed (left) (blue = Hoechst stained nuclei, orange = MitoTracker Orange stained mitochondria, and green = AlexaFluor® 488 Phalloidin stained actin). Image analysis masks (right) are shown as well (blue = positive nuclei, red = negative nuclei, and green = phalloidin stained actin). The concentrations of each compound treatment shown are as follows: staurosporine (0.123 μM), paclitaxel (0.00152 μM), and etoposide (11.111 μM).
Multi-parameter characterization of the effects of anti-cancer compounds
The five known anti-cancer compounds that were evaluated represent differing mechanisms of action: mitomycin C (DNA crosslinker), etoposide (topoisomerase II inhibitor), doxorubicin (DNA intercalator and topoisomerase II inhibitor), paclitaxel (microtubule inhibitor), and staurosporine (general protein kinase inhibitor). Anti-proliferative effects of compounds were evaluated based on total cell count numbers, which decreased in response to increasing concentrations of compounds (Figure 4). Viability, as determined by the total number, percentage and intensity of Calcein AM stained cells, decreased in response to increasing concentration of compound (Figure 4). The EC50 values for the percentage of live cells were right-shifted towards higher concentrations of compounds compared to the total cell number (Table 1). This demonstrates that the compounds inhibited cell proliferation at lower concentrations, and then induced cell death. The numbers and percentages of Calcein AM and phalloidin positive cells were comparable, suggesting that either marker can be used for detection of cell viability (Figure 5). Decrease in the intensity of Calcein AM stain was also consistent with trends for HeLa cell viability. The numbers and percentages for MitoTracker positive cells, and EC50 correlated well with the numbers and percentages of Calcein AM positive cells, suggesting that the selected compounds were unlikely to have a specific effect on mitochondria integrity or mitochondria potential.
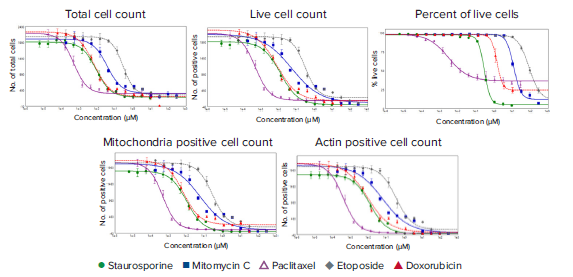
Figure 4. Dose-response curves demonstrate the effects of anti-cancer compound treatment on various parameters. The HeLa cells were imaged under live and fixed conditions with the ImageXpress Nano system and were analyzed with CellReporterXpress software. The Cell Scoring module was optimized to measure live cells stained with calcein AM, cells with the mitochondria label MitoTracker Orange, and cells with intact actin networks stained with AlexaFluor® 488 Phalloidin. The plots with 4-parameter logistic curve fits illustrate the effects of each anti-cancer compound. EC50 values are listed in Table 1.
EC
50
values (μM) ± Standard Deviation
Table 1. EC50 values generated from the 4-parameter curve fits shown in the Figures 4 and 5. Data represents the measurements obtained by using Cell Scoring (Live Cell, Mitochondria, and Actin) and Cell Count (Nuclei) preconfigured analysis modules. Standard error values are from the parameter estimate defined from the curve fit. The undefined standard errors indicate that although the curve fits have converged, the uncertainty in the parameter estimates could not be determined.
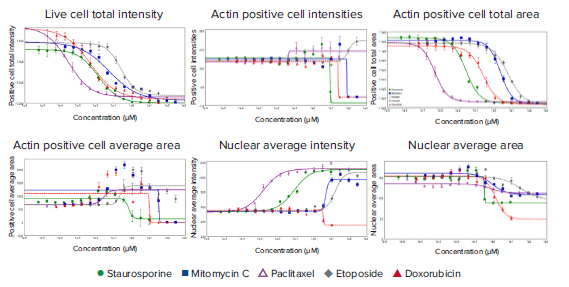
Figure 5. Readouts for intensity and area from optimized analyses modules. The Cell Scoring analysis module was optimized to analyze parameters associated with live cells and actin-positive cells. The Cell Count analysis module was optimized to analyze nuclear intensity and area. The Cell Scoring modules were run on-the-fly alongside image acquisition (live cells = pre-fixation, actin = post-fixation) with the ImageXpress Nano system using a 10X Plan Fluor objective. The Cell Count module was performed as an additional analysis after images were acquired. 4 -parameter curve fits were applied to the data from these readouts. EC50 values are in Table 1.
To further understand the actions of selected compounds, additional morphological readouts were used to characterize different phenotypic effects (Figure 5). Apoptotic or stressed cells tend to change spreading or attachment to the plate surface. This can be characterized by measuring an average cell area, or total area covered by live cells. The total area encompassed by the live cells (Calcein AM positive cells) or phalloidin stained cells decreased with increasing concentration of anti-cancer drugs, indicative of cell shrinkage (Figure 5). Cell area and intensity for phalloidin stain can be used for evaluation of cell spreading, cytoskeleton organization, or cell detachment. The average area of the phalloidin stained cells decreased with increasing concentrations of staurosporine, indicating cell shrinking, and detachment. Average cell area was slightly increased with increasing concentrations of paclitaxel and etoposide, which was consistent with observed phenotypic changes (Figures 2, 5). For mitomycin C and doxorubicin, the average cell area increased until the increasing concentration induced apoptosis, which caused a decrease in the average cell area (Figure 5). Interestingly, the increase in intensity of actin cytoskeleton staining was observed in conjunction with increasing concentration for paclitaxel, which inhibits the disassembly of microtubules. A similar effect was also observed for etoposide treated cells. Finally, the nuclear shape and intensity were used for defining apoptotic cells, since apoptotic nuclei have greater intensities and decreased area as a result of nuclear condensation. For staurosporine, etoposide, paclitaxel, and mitomycin, the average nuclear area decreased while the nuclear intensities increased in response to increasing compound concentration, which indicated that the cells were undergoing apoptosis (Figure 5). The exception was doxorubicin, where at the highest two concentrations, the nuclear intensity of the cells significantly decreased.
Conclusion
Automated cellular imaging methods for characterization of compound effects and comparison of their efficacy in cell-based assays, is an efficient tool for testing anti-cancer drugs. The ability to investigate a variety of cellular responses provides important information about the modes of action of different compounds. The ImageXpress Nano system in conjunction with CellReporterXpress software allows the user to analyze a variety of measurements and enable multiple readouts to characterize the phenotypic effects of tested compounds.
References
- Swinney DC, Anthony J (2011). How were new medicines discovered?. Nat Rev Drug Discov. 10 (7): 507–19.
- Kotz J (April 2012). Phenotypic screening, take two. Science-Business eXchange. 5 (15).
- Lee JA, Uhlik MT, Moxham CM, Tomandl D, Sall DJ (May 2012). Modern phenotypic drug discovery is a viable, neoclassic pharma strategy. J. Med. Chem. 55 (10): 4527–38.
- Haney SA, ed. (2008). High content screening: science, techniques and applications. New York: Wiley-Interscience.