
Application Note
Increase sensitivity in no-wash assays using confocal imaging
- Increase sensitivity to acquire high signal-to-background, crisp images
- Detect secondary labels at any wavelength
- Multiplex different cells in the same well
- Scale up to 1536-well plate experiments
Introduction
Screening of hybridoma supernatants for antibodies directed against cell-surface antigens is an important step in the discovery and development of antibodies for vaccines or therapeutic use. The sensitivity of these assays is increased by taking advantage of the optical properties of confocal imaging such as utilizing the narrow depth of field to acquire high signal-to-background, crisp images with no out of focus light creating image blur.
Homogeneous antibody binding assays allow rapid screening of surface binding to cells or beads in a no wash format. Suspension cells or beads can be used to test hybridoma supernatants for antibodies and cell loss is reduced by eliminating the dispense and aspirate steps required by traditional assays.
Imaging with ImageXpress® Micro Confocal High-Content Imaging System allows the scientist to pinpoint binding to cell surfaces, combine different cells or analytes in the same well with multiple fluorophores identifying separate markers, and reject background fluorescence due to media or fluorophores.
Homogeneous antibody binding assay procedure
The flow diagram (Figure 1) illustrates the assay steps. First, the beads or cells expressing the surface epitope (or target) for the analyte, the analyte itself, and the fluorescent detection antibody are combined. Following this step, the sample is incubated either a few hours at room temperature or overnight at 4°C before the wells are imaged and analyzed.
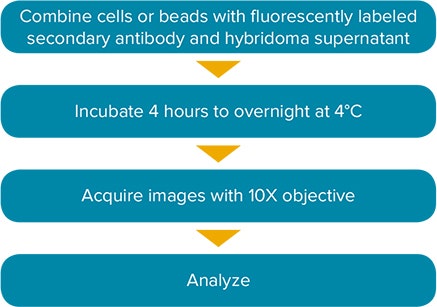
Figure 1. Assay workflow.
Sensitive detection of purified IgG binding to beads
In our bead-based assay, antibody-coated microspheres were combined with a fluorescently labeled secondary antibody and added to 384-well plates. Next, a titration of the analyte, in this case a human or mouse antibody, was added to the wells to generate a dose-response curve and determine the lowest limit of detection. The reagent concentrations were optimized and the materials used are presented in Table 1.
A single field of view was acquired per well using a 10X Plan Apo objective. Images were analyzed with MetaXpress® High Content Image Analysis Software using the Cell Scoring Application Module (for human antibody detection) and a custom module (for mouse antibody or a combination of multiplexed beads in one well) to determine the lower limit of detection (LLD) and the linear response of the analyte. The curve of the primary antibody titration experiment displays the well-known prozone or ‘hook effect’ associated with homogenous antibody binding assays (Figure 2C). This signal fall-off at the top of the curve is caused by excess unbound analyte in the media which binds to secondary antibodies, making it unavailable to bind to cells or beads (Figure 2B).
Table 1. Materials for homogeneous antibody binding assay for beads.
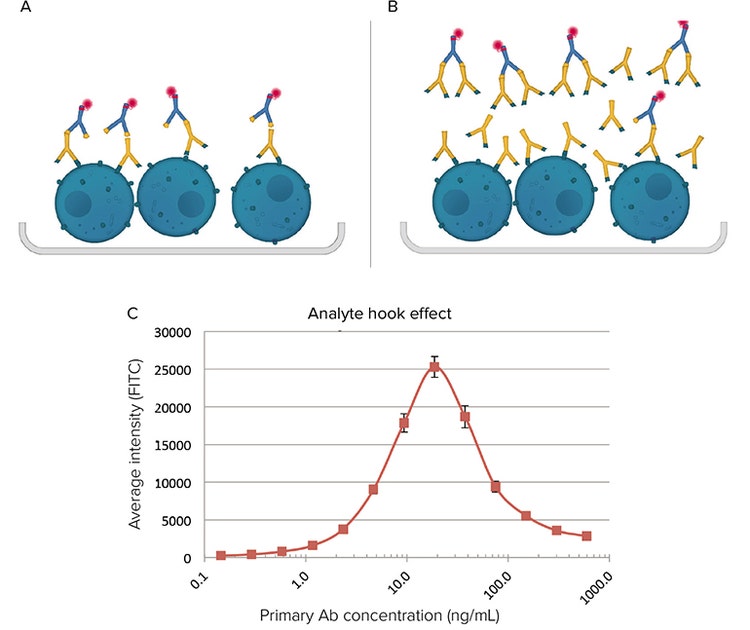
Figure 2. Homogeneous antibody binding assay. A. Only the signal from cells or antibody-coated beads that sit at the bottom surface of the well is detected. B If analyte levels are higher than the concentration of the binding proteins, they may bind too much of the secondary antibody in the media causing a high background but low specific signal, leading to a decrease in detected fluorescence intensity and the “hook effect” that is common to homogeneous assays. C An example of hook effect in the homogeneous bead assay.
Improve sensitivity using confocal optics
Two representative bead-based assays were developed which utilize commercially available polystyrene microspheres. To compare assay performance, images were acquired in both widefield and confocal mode using a 60 µm pinhole (Figure 3). Comparisons of widefield and confocal imaging consistently showed that confocal acquisition led to 4-8 times more sensitive antibody detection.
Acquire and analyze in half the time by multiplexing
The assay could also be multiplexed by combining 3 µm diameter beads that were coated with antibody against human IgG with 7 µm diameter beads that were coated with antibody against mouse IgG in one well. The smaller anti-human beads fluoresce in the Cy5 wavelength spectra (\~647 ex/670 em). The analytes added to the well were 1:2 dilutions of either purified mouse IgG, purified human IgG, or a combination of both. Since the secondary antibodies for each were labeled with fluorophores of different wavelengths, the binding of both antibody species could be separately and accurately measured (Figure 4).
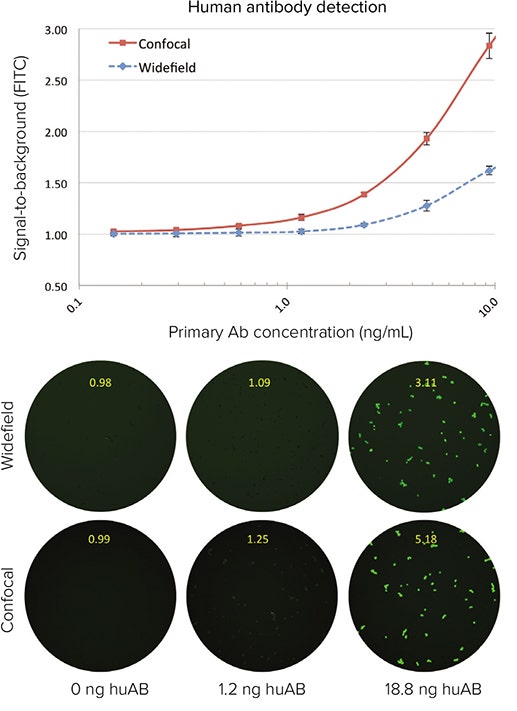
*Figure 3. Top: Comparison of binding curves of each antibody acquired with either widefield or confocal optics shows that more sensitive detection is possible using confocal images. Signal to background was determined by dividing fluorescence intensity of the beads by the average intensity of beads that were incubated with AlexaFluor 488-labeled secondary antibody in the absence of analyte. The Lower Limit of Detection (LLD) using confocal imaging is 0.3 ng/mL vs. 2.3 ng/mL for widefield. **Bottom: Corresponding representative images for the homogeneous bead assay.*Widefield images show higher background in the field-of-view (green) and lower signal-to-background ratios as shown by the measurement in yellow text on each image. Plates were imaged at 10X magnification (but are zoomed here for viewing) and >1000 beads were visible in one field of view.
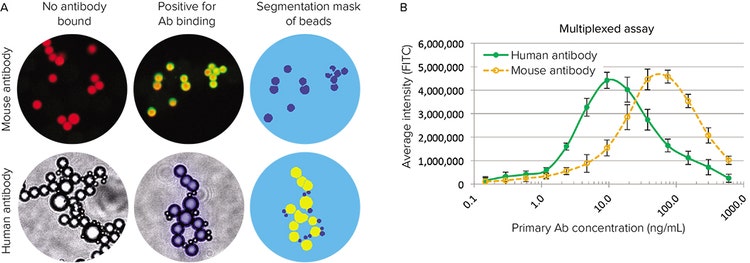
Figure 4. Multiplexing by combining beads coated with antibodies for either human or mouse IgG detection. A. Left: Images show each bead type with no antibody complex formed. Center: Images showing beads with antibodies bound (red is fluorescent anti-human bead, monochrome is unlabeled anti-mouse bead, green/red overlay shows goat anti-human AF488 binding, and blue/monochrome overlay shows goat anti-mouse AF546 binding). Right: Transmitted light images show the smaller anti-human beads visible alongside the anti-mouse beads but the software segregates the two bead populations for analysis. Segmentation masks on right show anti-human beads designated by yellow and anti-mouse beads designated by royal blue). For illustrative purposes, images shown were acquired with a 20X objective and are zoomed to different amounts to show the beads clearly. B. By plotting the background subtracted signals it was found that the LLD in this multiplexed assay was 1.2 ng/mL for human antibody and 0.3 ng/mL for mouse antibody.
Side-by-side assays to evaluate the performance of the multiplexed bead assay compared to analyzing for a single antibody showed the lower detection limit of the antibody analytes was always within a factor of 2 (data not shown).
Screen hybridoma supernatant for secreted antibodies
In this experiment, a 96-well plate of hybridoma supernatants was screened. The supernatant was tested both at full concentration and after diluting 1:10 into the assay buffer listed in Table 1. Beads coated with anti-human IgG were combined with a fluorescently labeled secondary antibody and 50 µL was added to a 384-well plate. Finally, the supernatant samples were added and incubated for four hours at room temperature. Since supernatant tested at full concentration often contain large particles that fluoresce in the FITC wavelength, a custom module was created that added steps to eliminate the debris from analysis before utilizing the Cell Scoring Analysis Module to measure fluorescence that was specifically associated with the beads (Figure 5). A montaged view of the wells allows immediate identification of the supernatants that contained antibody (Figure 6).
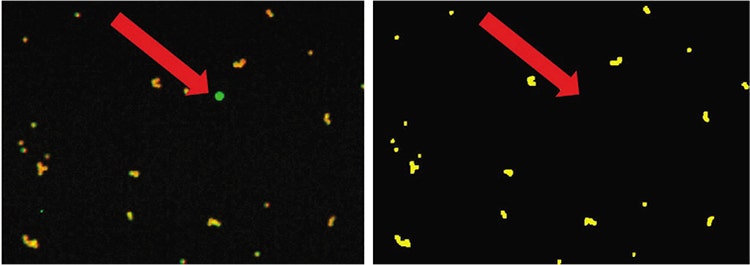
Figure 5. Large bright fluorescence artifacts in the supernatant image that were not associated with a bead were filtered out. The arrows show the artifact on the left in the overlaid image of the bead (red) with labeled antibody (green) and the elimination of the artifact in the segmentation mask (yellow) on the right.
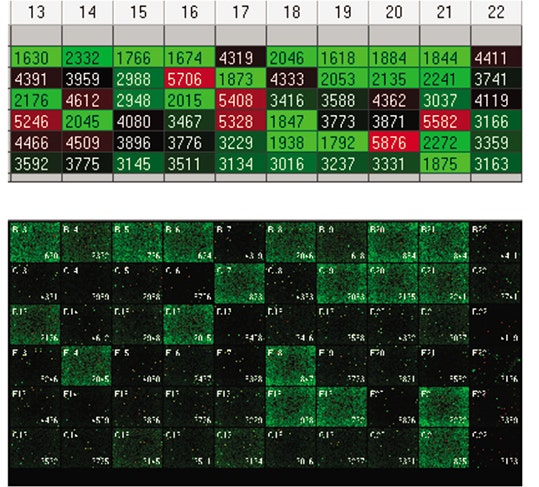
Figure 6. Thumbnail images of the wells run at a 1:10 dilution of supernatant as well as a heat map representing the fluorescence intensity measured on the beads in each well. In the heat map view (top), red wells had a high amount of antibody bound to beads while green wells had the lowest. In the thumbnail montage (bottom) the wells with a lot of unbound fluorophore in the background, instead of concentrated on the beads, appear the brightest green when all viewed on the same intensity scale.
Conclusion
Imaging of homogeneous antibody binding assays using the ImageXpress Micro Confocal System results in crisp images of fluorescently labeled antibody bound to beads or cells against a low background signal, even if the fluorescent antibody is abundant in the media. Using MetaXpress analysis software to eliminate common assay artifacts produces cleaner, more accurate results. In addition, the platform provides flexibility to detect secondary labels at any wavelength, multiplex different cells in the same well, and scale up to 1536-well plate experiments without compromising assay sensitivity.
Learn more about ImageXpress Micro Confocal High-Content Imaging System >>