
Application Note
AI-Driven 3D Segmentation and Drug Toxicity Screening Using Human Liver Microtissues
- Provides a physiologically relevant platform for early hepatotoxicity assessment by integrating 3D liver microtissue models with high-content imaging and AI-driven analysis, enabling more translational in vitro safety screening.
- Enables deeper and more accurate quantitative analysis of complex 3D biology through the SINAP™ 3D segmentation module and 3D Viewer, delivering enhanced visibility into cellular features and structural changes.
- Supports robust phenotypic classification and data quality assessment using the IN Carta® Phenoglyphs™ module, allowing researchers to distinguish distinct phenotypic profiles while simultaneously validating image and dataset integrity.
Zhisong Tong, PhD, Prathyushakrishna Macha, PhD, Oksana Sirenko, PhD | Molecular Devices, LLC
Judi Wardwell | InSphero
Introduction
Three-dimensional cells offer a promising approach for assessing important biological effects and generating actionable insights during drug development. However, the complexity of analysis often becomes a bottleneck in getting important information from advanced biological systems. Machine learning holds a great promise for facilitating complex analysis. In this study, we employed InSphero’s InSight™ Human Liver Microtissues to establish an imaging-based in vitro assay for toxicity evaluation. Using High-Content Imaging combined with AI-driven image analysis for 3D segmentation and classification, we quantified multi-parametric responses of 3D liver microtissues to various compounds, enabling a comprehensive assessment of drug-induced effects.
Liver toxicity remains a major safety concern in drug development. Drug-Induced Liver Injury (DILI) is a leading cause of drug withdrawals and black-box warnings after approval. Conventional cell-based and animal models often fail to accurately predict hepatotoxicity, limiting their utility in early-stage screening. More reliable in vitro assays could help reduce drug attrition, improve patient safety, and accelerate development. Furthermore, understanding the mechanisms underlying liver toxicity is critical for designing safer compounds and anticipating DILI risk in clinical settings.
Leveraging AI-driven analytics, it automates complex evaluation steps, ensuring faster, more consistent, and reproducible compound testing. This approach streamlines toxicity assessment by eliminating the need for manual image processing.
Methods
Cell culture and treatment
3D Insight™ Liver microtissues (provided by InSphero) were grown in Akura™ 384 Spheroid Microplates. This model is comprised of primary liver parenchymal and non-parenchymal cells. Microtissues were received in maintenance medium, which was exchanged for TOX medium upon receipt, and at the next media exchange, compounds in TOX medium were added to the wells. Compound additions were done from a 96-well master plate to quadruplicate assay wells of the 384-well culture plate. Microtissues were incubated with compounds for five days without additional media exchange.
Cell staining and imaging
After incubation with compounds microtissues were stained with MitoTracker Deep Red (Cy5 channel) and Hoechst (DAPI channel), then fixed with 4% formaldehyde, permeabilized with 0.1% of TritonX and then stained with a panel of “cell paint” dyes for various cell components. Imaging was performed using ImageXpress® HCS.ai Advanced High-Content Screening System with confocal spinning disk, 10X objective.
Image analysis
To analyze the images, we utilized IN Carta® Image Analysis Software, which incorporates a deep learning tool (SINAP) for object segmentation and machine learning tool (Phenoglyphs™ Software Module) for object classification. For 3D segmentation, a SINAP model for 3D analysis was trained and optimized using 60 regions of interest (ROIs) on the Cy5 channel. The trained model was then applied to segment microtissues in three dimensions. Then each object was analyzed using 3D Flexi Protocol to extract features. Subsequently, 44 features—spanning morphology, intensity, spatial distribution, texture, and colocalization—were extracted for each object and imported into Phenoglyphs. A classifier was trained to categorize objects into Live, Damaged, and Garbage (non-cellular artifacts) classes. Based on these classifications, we derived three levels of drug effect.
Results
Flex Protocol 3D offers 3D segmentation tool
Performing 3D segmentation on cells offers significant benefits by enabling a more accurate and comprehensive quantitative analysis of cellular characteristics and interactions within their native spatial context. This approach provides crucial insights that are difficult or impossible to obtain using traditional 2D methods, such as cell volume and internal cellular organization. In Flex Protocol 3D module, IN Carta Software offers SINAP 3D segmentation for this purpose. IN Carta Software SINAP is a deep learning-based module that uses AI to automatically detect and segment complex biological objects in images, improving accuracy and speed for high-content analysis.
We began with training a SINAP model on mitochondria (Cy5) channel that is suitable for SINAP 3D segmentation. A total of 60 ROIs with corresponding masks were generated for training AI model, covering representative top layer, middle layer and bottom layer of both control microtissue and compound treated microtissue (Figure 2A). The trained AI model was then applied in SINAP 3D with Cy5 channel as segmentation wavelength (Figure 2B).
Figure 3 shows the segmentation results across different layers of a single microtissue, ranging from the bottom— where the outline is irregular—to the top, where the segmentation approaches a nearly circular shape.
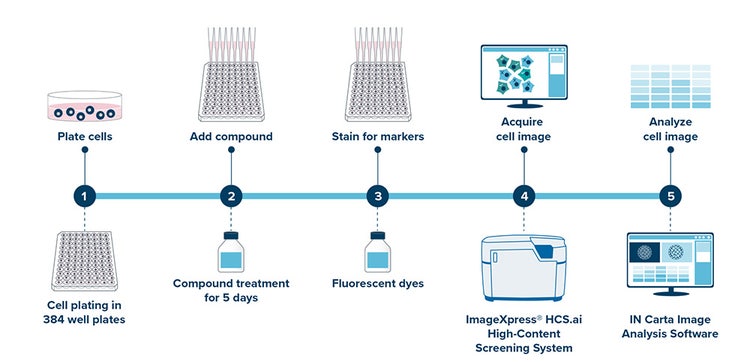
Figure 1. End-to-end workflow for in vitro drug toxicity assessment.
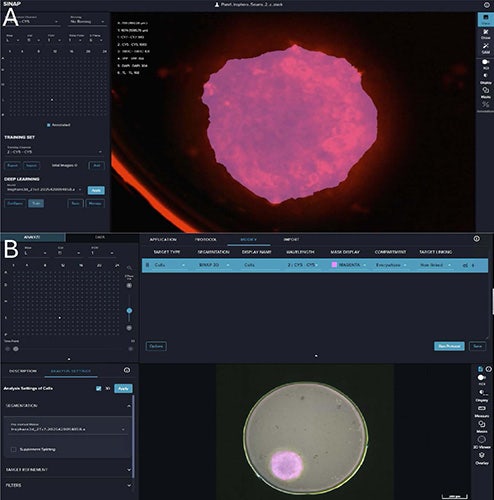
Figure 2. A. Screenshot of SINAP page of training 3D AI model using Cy5 channel; B. Screenshot of Interactive page of applying SINAP 3D segmentation.
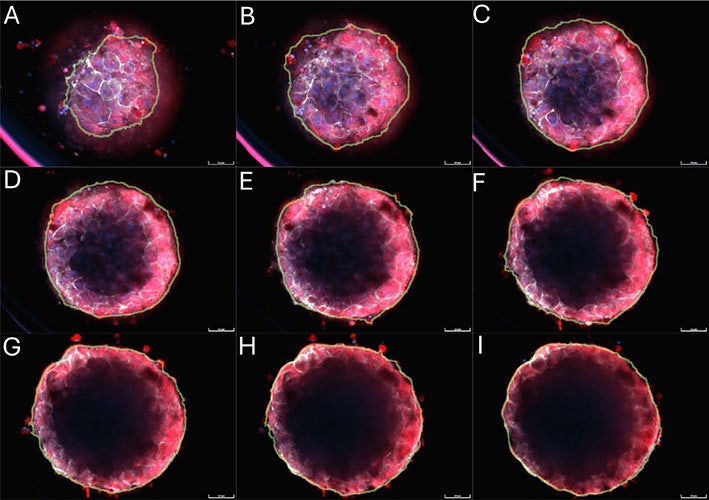
Figure 3. A–H. Overlay of mitochondria (Cy5, Red), Actin (Cy7, Grey), Nuclei (DAPI, Blue) and segmentation mask outline (Green) from different layers of a single microtissue.
ImageXpress HCS.ai Advanced System offers Cy7 acquisition
Fluorescence multiplexing is a powerful bioassay technique that uses multiple fluorescent dyes (fluorophores) to simultaneously examine and measure multiple targets within a single biological sample. This approach allows researchers to observe related components and processes in parallel, providing more meaningful, information-rich results compared to traditional single-plex assays. However, the multiplexing assay is often limited by the number of spectrally separated channels and “crosstalk”, where the wide emission spectrum of one fluorophore overlaps with the detection channel of another.
Offering Cy7 acquisition by the ImageXpress HCS.ai Advanced System significantly enhances multiplexing capabilities by utilizing the near-infrared (NIR) spectrum, which allows for the addition of an extra detection channel to experiments without interfering with commonly used visible-range dyes. Figure 4 presents five fluorescent stains of the microtissue, each highlighting distinctive cellular features. The high-resolution Cy7 image clearly reveals the actin structure within the microtissue.
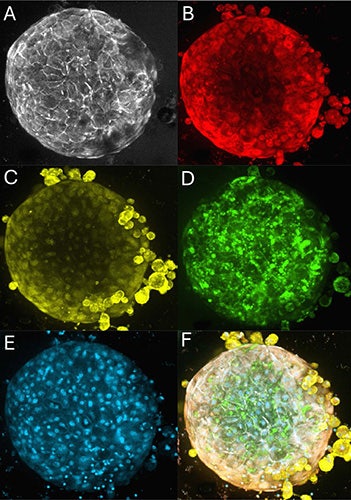
Figure 4. A. Representative image of Actin in Cy7 channel (Grey); B. Mitochondria in Cy5 channel (Red); C.Golgi in TRITC channel (Yellow); D. RNA content in YFP channel (Green); E. Nuclei in DAPI channel (Blue); F. Overlay of all above channels.
3D Viewer reveals stereoscopic morphological changes of microtissues
Compound treatments induce a wide array of observable morphological alterations in microtissues, involving visible changes in the structure of microtissues (Figure 5). A 3D viewer for microtissue structure changes provides a more physiologically relevant and comprehensive understanding of drug effects compared to 2D analysis. IN Carta Image Analysis Software offers a 3D Viewer tool where one can visualize combinations of raw images and target masks by choosing what to display (Figure 6A). Figure 6 presents a 3D rendering of segmented masks, comparing the control microtissue (Figure 6B), which displays a circular structure with an increasing radius from bottom to top, to the compound-treated microtissue (Figure 6C), which exhibits irregular morphological alterations.
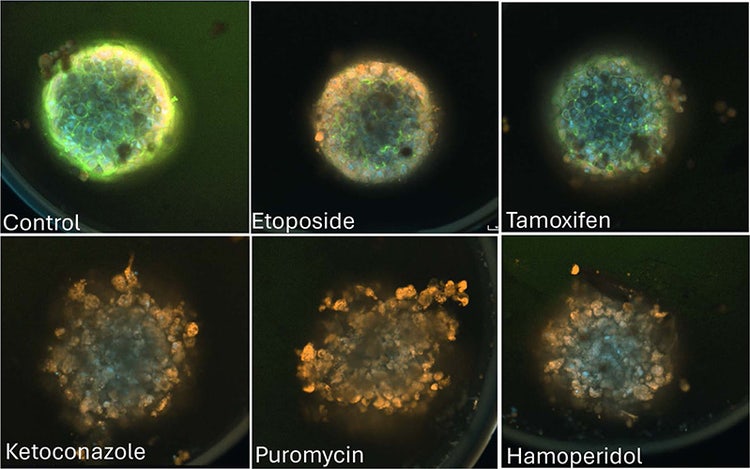
Figure 5. Representative image of microtissues exposed to various compounds (Actin (Green), Mitochondria (Red), Golgi (Yellow) and DAPI (Blue). Noted: the above images are one z-plane at the bottom part of the microtissue, not 2D projection.
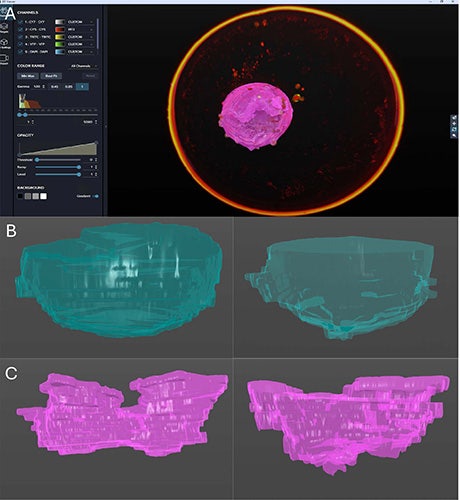
Figure 6. A. Screenshot of the 3D Viewer; B. 3D rendering of masks of a control microtissue; C. 3D rendering of masks of a compound-treated microtissue.
Phenotypic classification of microtissues and quality assessment by IN Carta Phenoglyphs Software Module
A segmentation model segments the object of interest but may also segment debris that impacts the output. IN Carta Phenoglyphs Software Module, a machine learning tool that classifies cells and objects in complex biological images, can be used to not only classify distinct phenotypic profiles, but also as a quality assessment tool.
In this work, we classify the 3D segmentations into three categories: Live, Damaged, and Garbage. As shown in Figure 7A, the Live category primarily consists of microtissues with regular morphology and intact edges, whereas the Damaged category includes microtissues exhibiting irregular shapes and bumpy edges. The Garbage category represents either the absence of microtissues or the presence of debris.
We reviewed each well to confirm that it contained either one live microtissue, one damaged microtissue, or was empty due to loss during plate handling. We observed more damaged microtissues appearing as the increased concentration of the drugs except a few outliers which are either due to lower cy5 staining or microtissue being stuck far away from the well bottom.
By analyzing the drug concentration at which damaged microtissues emerge, the drug toxicity effects on microtissues can be classified into three distinct levels:
- High toxicity effect (≤1.563 μM): Aurasperone, Rotenone, Puromycin, Doxorubicin.
- Medium toxicity effect (≥6.25μM and ≤25 μM): Ketoconazole, Haloperidol.
- Low or no toxicity effect (≥100μM): Amiodarone, Tamoxifen, Pimozide, Etoposide.
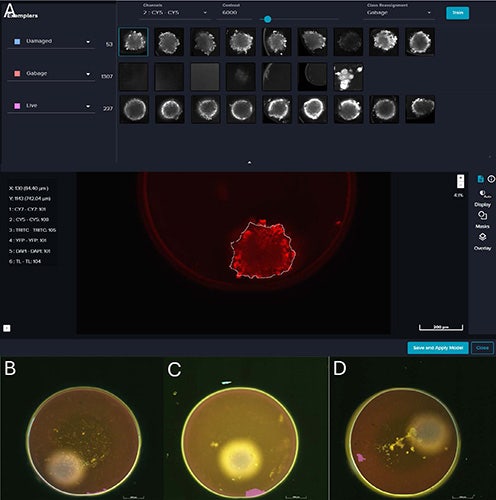
Figure 7. A. Screenshot of IN Carta Phenoglyphs Software Module to classify microtissues into Damaged, Live and Garbage; B–D. Examples of garbage masks.
Conclusions
Integrating 3D liver microtissue models with high-content imaging and AI-driven analysis offers a robust, physiologically relevant platform for early hepatotoxicity assessment in drug development. This approach overcomes limitations of conventional models by enabling automated, multi-parametric evaluation of drug-induced effects, improving accuracy, consistency, and throughput. Advanced tools such as SINAP 3D segmentation module, fluorescence multiplexing with Cy7 acquisition, and In Carta Phenoglyphs Software module-based classification further enhance data richness and quality control, while 3D visualization provides deeper insights into structural changes. Collectively, these innovations streamline toxicity screening, reduce drug attrition, and support safer compound design.