
Application Note
Overcoming LFA limitations: High-precision PSA testing with Bright-Dtech™ nanoparticles and ScanLater® technology
- Bright-Dtech™ nanoparticles combined with ScanLater® technology offers superior sensitivity compared to conventional lateral flow assays
- Precise quantification of fluorescence intensity enables quantitative lateral flow assays with accurate determination of analyte concentrations
- ScanLater® technology permits multiplexed analysis of multiple test strips for increasing throughput and efficiency in high-volume workflows
Caroline Cardonnel, PhD | European Applications Supervisor | Molecular Devices
Juliette Lajoux, MSc | Research Engineer, Biology | Poly-Dtech
Susana Brun, PhD | Biology Manager | Poly-Dtech
Mohamadou Sy, PhD | Chemistry Manager | Poly-Dtech
Introduction
Lateral flow assays (LFAs) are widely utilized in diagnostic applications due to their rapid response time, ease of use, and cost-effectiveness. However, conventional LFAs are often constrained by limitations in sensitivity, specificity, and quantitative accuracy, typically providing only qualitative results. To address these challenges, advanced technologies are required to enhance LFA performance and expand their diagnostic capabilities.
This study demonstrates how the integration of Molecular Devices’ ScanLater® Western Blot Detection System with Bright-Dtech™ nanoparticles, a proprietary technology from Poly-Dtech, effectively overcomes the intrinsic limitations of conventional LFAs. Originally developed for high-sensitivity fluorescence detection in Western blotting, the ScanLater® system can be repurposed to significantly enhance lateral flow testing, particularly when combined with Bright-Dtech™ technology.
Bright-Dtech™ nanoparticles offer a distinct advantage for LFAs due to their unique lanthanide-based probes, which provide exceptional brightness, photostability, and minimal background interference—critical factors for precise and sensitive fluorescence-based detection. These nanoparticles ensure robust signal intensity, enabling accurate quantification even at low analyte concentrations.
By integrating the ScanLater® system’s quantitative fluorescence measurement capabilities with the enhanced signal stability and brightness of Bright-Dtech™ probes, this approach extends the analytical performance of LFAs beyond their traditional constraints. To illustrate the potential of this combined technology, we present a lateral flow assay specifically developed for the quantitative detection of prostate-specific antigen (PSA). This example highlights the increased sensitivity, accuracy, and reliability achieved through this innovative approach, demonstrating its applicability to high-precision testing in both clinical development and laboratory settings.
Advantages of Bright-Dtech nanoparticles + ScanLater technology
- Quantitative Lateral Flow Assay: The integration of Bright- Dtech™ nanoparticles with ScanLater® technology enables precise quantification of fluorescence intensity, allowing for accurate determination of analyte concentrations through the test line-to-control line ratio (TL/CL).
- High Sensitivity: Bright-Dtech™ nanoparticles enhance detection sensitivity due to their extended fluorescence lifetime, enabling the reliable quantification of low analyte concentrations.
- Reduced Background Noise: The time-resolved fluorescence (TRF) capabilities of ScanLater® technology significantly reduce background interference, resulting in clearer and more accurate signal detection.
- Superior Sensitivity Compared to Conventional Lateral Flow Assays: The combined use of Bright-Dtech™ nanoparticles and ScanLater® technology enhances analytical performance, surpassing the sensitivity of traditional lateral flow assays.
- Multiplexed Analysis: The ScanLater® system allows for the simultaneous analysis of multiple test strips, increasing throughput and efficiency in high-volume diagnostic workflows.
- Versatile Applications: This technology is adaptable to a wide range of analytes and sample types (plasma, serum, saliva, cells, water, etc.), making it suitable for diverse applications across clinical development, research, veterinary, or even agri-food settings.
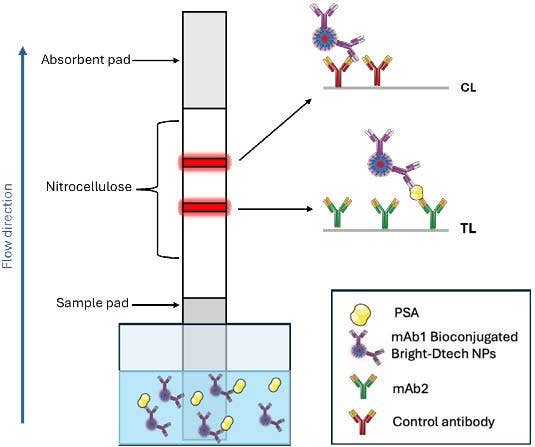
Figure 1. Schematic illustration of the LFA structure for the detection of PSA using a dipstick assay format.
Assay principle
Using Bright-Dtech™ nanoparticles, we developed a dipstick lateral flow assay for the quantitative detection of an analyte, using prostate-specific antigen (PSA) as a model. In this assay, Bright-Dtech™ lanthanide nanoparticles replace conventional detection probes, such as gold nanoparticles or traditional europium chelates, to achieve highly sensitive detection with enhanced fluorescence properties.
The test strip consists of a nitrocellulose membrane with two primary detection lines: the test line (TL) and the control line (CL). The TL contains immobilized antibodies specific to the target antigen, which bind the analyte if present in the sample, capturing the nanoparticle- labeled complexes and generating a fluorescent signal proportional to the analyte concentration. The CL serves as an internal control, ensuring assay validity by capturing excess nanoparticles and producing a fluorescence signal independent of analyte presence.
To accurately quantify the fluorescence signal at both the TL and CL after migration, we repurposed the ScanLater® module, originally designed for high-sensitivity fluorescence detection in western blot analysis. The system accommodates up to 20 strips simultaneously, enhancing assay throughput and consistency. The SpectraMax® iD5 Multi-Mode Microplate Reader with ScanLater® system, equipped with time-resolved fluorescence (TRF) detection, is particularly well-suited for this application, as its optimized fluorescence reading parameters align with the luminescence properties of Bright-Dtech™ nanoparticles.
Note: The iD5 reader has been updated to a newer model, the SpectraMax iD5e Multi-Mode Reader, which has equivalent features and performance, plus optional SpectraMax aer Gas Mixer and advanced shaking features.
Fluorescent images of the lateral flow strips are acquired in TRF mode with a 0.05 ms delay between excitation (350 nm) and emission (616 nm). This configuration significantly reduces background noise from autofluorescence and other short-lived emissions, particularly those originating from the nitrocellulose membrane, leading to a clearer and more reliable quantitative readout.
The fluorescence intensity at the TL and CL is quantified using ImageJ (National Institutes of Health, Bethesda, MD), leveraging the “gel analysis” tool. This tool enables the selection of each strip and transforms band intensities into peak profiles, with the area under the curve corresponding to fluorescence intensity. To standardize results and facilitate comparisons across different assays, we calculate the test line-to-control line ratio (TL/CL), which serves as a normalized measure of analyte concentration.
Sensitivity and dynamic range
Calibration curves for detecting PSA were generated by dispensing 5 μL of conjugated nanoparticles and 75 μL of serial dilutions of PSA antigen (ranging from 0 to 300 ng/mL in migration buffer, n = 4) into the wells of a 96-well plate. The test strips were then immersed and allowed to migrate for 20 minutes before being air-dried.
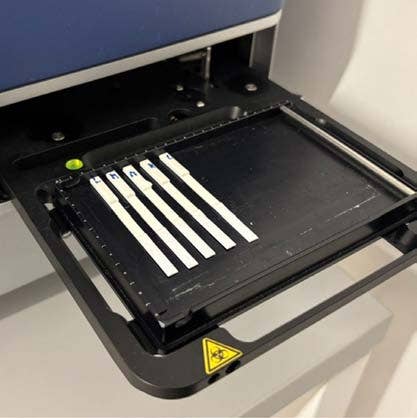
Figure 2. Strips for the PSA LFA placed on the ScanLater™ system of the TRF SpectraMax® iD5 reader.
The strips were aligned in the rack (Figure 2) of the ScanLater® system and scanned. Additional images were captured under a UV lamp to visually assess the limit of detection (LoD), which was compared to results obtained using ScanLater® technology (Figure 3).
The images were captured using the ScanLater® system and processed with ImageJ software to extract the data. The resulting data were modeled using a 5-parameter logistic (5PL) model in SoftMax Pro™ Software (Molecular Devices) (Figure 4). The system achieved a limit of detection (LoD) of 15 picograms/mL of PSA, which significantly outperformed the visual LoD and demonstrated sensitivity comparable to that of commercial ELISA tests.
This sensitivity, along with the reliability of the reading mode, enabled the successful quantification of patient plasma samples. The results obtained are comparable to those achieved with the reference method (a direct two- site sandwich chemiluminescent immuno-assay (Siemens Healthineers)) used by medical analysis laboratories (Figure 5), further demonstrating the effectiveness of the ScanLater® module for reading Bright-Dtech™ lateral flow tests.
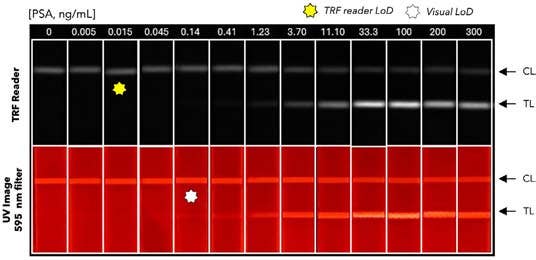
Figure 3. Typical images captured with a smartphone and a 595 nm filter under UV light and with the SpectraMax iD5 reader carried out with two-fold serially diluted PSA standard in migration buffer and a negative control (0 ng/mL PSA). White and yellow stars indicate the limits of detection.
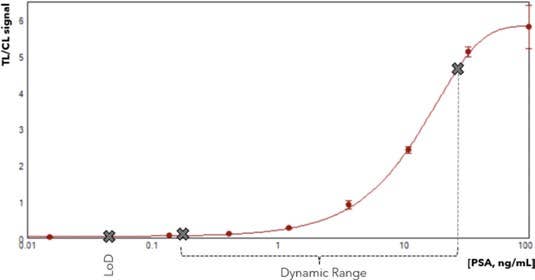
Figure 4. The calibration curve plot of (B) representing the normalized test line by control line (T/C) signal (n=4).
Conclusion
In summary, the integration of Bright-Dtech™ nanoparticles and ScanLater® technology into lateral flow assays represents a significant advancement in diagnostic testing. The enhanced sensitivity of Bright-Dtech™ nanoparticles, combined with the superior background reduction capabilities of ScanLater® technology, enables the detection of low analyte concentrations with high accuracy. Our dipstick assay for Prostate-Specific Antigen (PSA) exemplifies this potential, demonstrating a limit of detection comparable to that of traditional ELISA tests while offering the advantages of a rapid and user-friendly format.