
Application Note
High-content 3D toxicity assay using iPSC-derived hepatocyte spheroids
- Form hepato-spheroids using human iPSC-derived hepatocytes
- Assess hepatotoxicity using 3D models for in vitro screening
- Analyze 3D images to determine appropriate detection and segmentation of objects
Introduction
There is increasing interest in exploring the use of three-dimensional (3D) spheroids for modeling developmental and tissue biology with the goal of accelerating translational research in these areas.1-3 As a result, the development of higher throughput quantitative assays using 3D cultures is an active area of investigation. In this study, we developed and optimized methods for the formation of 3D liver spheroids derived from human iPS cells as well as confocal imaging and analysis methods for toxicity assessment (Figure 1).
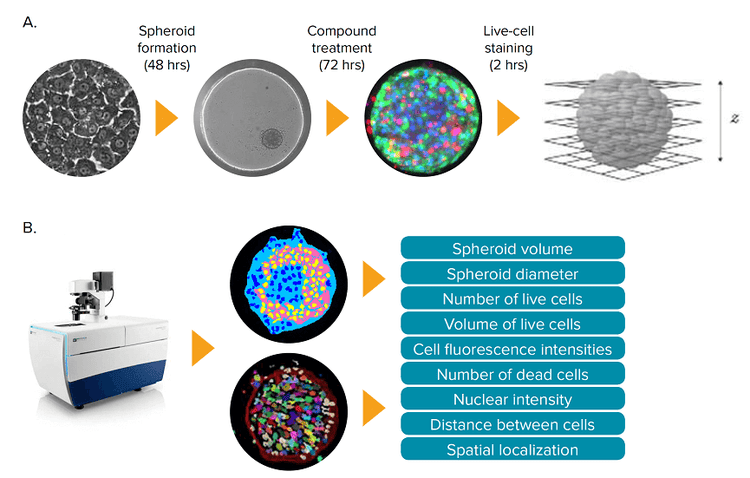
Figure 1. Hepatotoxicity assay using 3D spheroid liver micro tissues derived from iCell Hepatocytes. (A) iCell Hepatocytes were grown in 2D format for 7 days prior to using them to prepare 3D cultures. Following spheroid formation, the liver micro tissues were treated with compounds for 72 hours, then stained for 2 hours and imaged. Z-planes were acquired using the ImageXpress Micro Confocal system. (B) The acquired Z-plane images were used to generate sets of 2D and 3D image segmentation, which were analyzed to quantify key phenotypic features of the 3D cultures.
Formation of liver spheroids
Human iPSC-derived hepatocytes4, iCell Hepatocytes 2.0 (Cellular Dynamics International) and HepG2 (ATCC) were used in the study. Cryopreserved cells were thawed and maintained according to manufacturer protocols. To prepare spheroid cultures of human iPSC-derived hepatocytes, iCell Hepatocytes 2.0 were pre-plated in 2D culture, then detached with Accutase, mixed with a Geltrex solution (ThermoFisher Scientific), and plated into low attachment spheroid plates (InSphero or Corning) at 1000 cells/well. Next, we centrifuged at 300 x g for 2 minutes to settle the cells and remove any bubbles prior to placing the plate into a humidified incubator at 37°C, 5% CO2. HepG2 cultures did not require the addition of matrix. Spheroids were formed within 24–48 hours.
Assess hepatotoxicity using no-wash staining protocol
Following a 72 hour incubation with hepatotoxic test compounds, spheroids were stained with a mixture of three dyes prepared in sterile phosphate buffered saline (PBS): 2 μM calcein AM, 3 μM of EthD-1, and 10 μM Hoechst 33342 (Life Technologies). In separate experiments, CellEvent Caspase 3/7 reagent, 7.5 μM and MitoTracker Orange, 200 nM (Life Technologies) were used to evaluate the compounds’ ability to trigger apoptosis signaling or affect mitochondria.
Dye solutions were added onto the spheroid cultures and incubated for 2 hours prior to imaging. The dye solution was not washed out and care was taken during pipetting to avoid spheroid loss, disintegration, or displacement. Representative composite images of spheroids are shown in Figure 2.
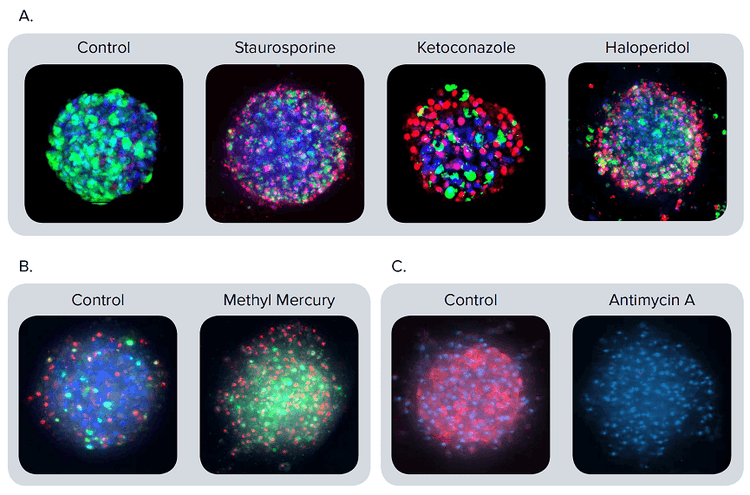
Figure 2. Representative composite images of spheroids stained with different markers. (A) The spheroids were treated with staurosporine 1 μM, ketoconazole 30 μM, or haloperidol 30 μM for 72 hours. Composite images presented after staining with calcein AM (green), Hoechst (blue), EthD-1 (red). (B) Apoptosis is apparent in the composite images of spheroids stained with CellEvent Caspase 3/7 (green), EthD-1 (red), and Hoechst (blue). Spheroids treated for 24 hours with methyl mercury (1 μM) exhibit a much higher number of apoptotic cells (green) than the control. (C) Composite images for the control and antimycin A (3 μM) treated spheroids stained with MitoTracker Orange (red) and Hoechst (blue). The antimycin A disrupts the mitochondrial membrane integrity. Therefore, no staining of the mitochondria is apparent.
Implement high-throughput 3D image acquisition and analysis
Images were acquired using the ImageXpress® Micro Confocal High-Content Imaging System (Molecular Devices), with a 10× Plan Fluor and 20× Plan Fluor objective. A stack of 11-17 images separated by 5-10 μm, a distance of 100 and 120 μm, were acquired using confocal imaging, starting at the well bottom. All individual images including 2D maximum projection images, were saved and used during analysis.
Detect and analyze 3D objects
3D image analysis was performed using MetaXpress® High-Content Image Acquisition and Analysis Software. The most recent Custom Module Editor features a new module (Figure 3) which simplify quantification of 3D structures with volume, fluorescence intensity, and distance measurements in multi-well workflows. The “Find Spherical Objects” option defines roughly spherical objects from organelles to multi-cell, using userdefined settings for the approximate size of the object (minimum and maximum width, minimum and maximum numbers of Z-planes), and object intensity versus background threshold values. For example, nuclei were defined with 5-15 μm widths, 1-2 Z-planes, and threshold values of 200 relative fluorescence units. Hepatic spheroids were defined with 100-300 μm widths, 5-11 Z-planes, and a threshold value of 400 relative fluorescence units. Spherical object analysis may include individual or averaged spheroid volume, spheroid diameter, and average or integrated intensities of spheroids in specific fluorescence channels.

Figure 3. The Custom Module Editor can be used for defining spheroids. Once defined, spheroids can be analyzed with counting and characterizing individual cells, nuclei, or cytoplasm positive or negative for the marker of interest.
Find Spherical Objects analysis can also be used to define individual nuclei and cells as well as appropriate characteristics of individual cells as separate objects. Additional capabilities of the 3D structure analysis module include the ability to connect objects from different planes according to the user defined options “Connect by Best Match”, “Connect by Touching”, and “Do Not Connect Objects”.
Individual Z-planes are first segmented and analyzed as 2D images, for measurements such as nuclei count, live/ dead analysis, and cell scoring. Then objects are “Connected by Best Match” with user defined maximum displacement of each object, e.g. 3-6 μm for maximum displacement of nuclei and 20-30 μm for cytoplasm. As a result, nuclei or individual cells are segmented and scored in the 3D volume, without missing objects or counting any object twice. These steps allow all cells such as calcein AM positive or negative cells, and Ethidium homodimer positive and negative cells to be defined and enumerated.
Different colors can be used on individual cells to segment integrated and average intensities, volumes, diameters, distance between objects, and location of objects in three-dimensional space. Then, spheroid masking can be used to enumerate smaller objects that should be included or excluded from the mask. For example, in a hepatocyte spheroid assay which contains one spheroid per well, single-cell masking allows all cells to be enumerated and is able to distinguish cells included or excluded from the spheroid. This step is important in cases where spheroid integrity has been compromised. In the case of several or multiple spheroids per well (e.g. spheroids in a matrigel assay) using a similar analysis can also define the cellular content of each spheroid and report averaged measurements. Figure 4A illustrates the result of cell scoring analysis for calcein AM positive cells in different 2D planes. Finally, objects are connected in 3D space using the “Connect by Best Match” option. A similar approach was used to define ethidium homodimer positive and negative cells (live/dead analysis) and can be applied to the analysis of mitochondrial, intensity, apoptosis, or other desired stains and markers.
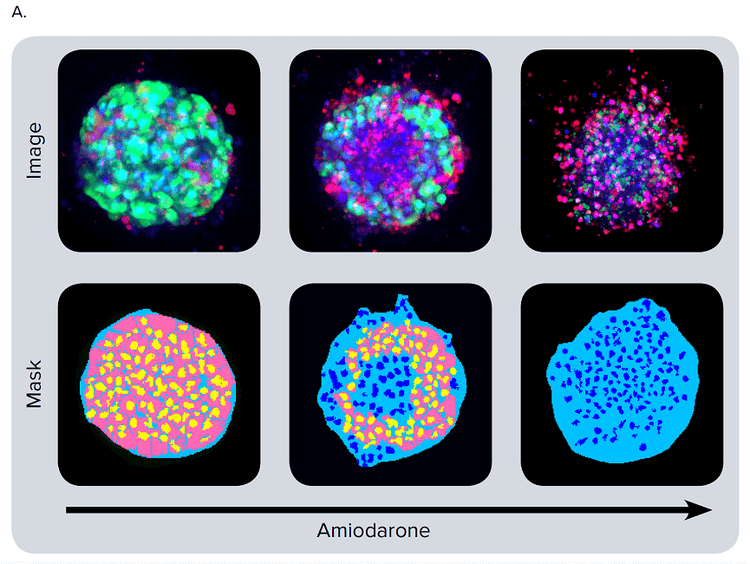
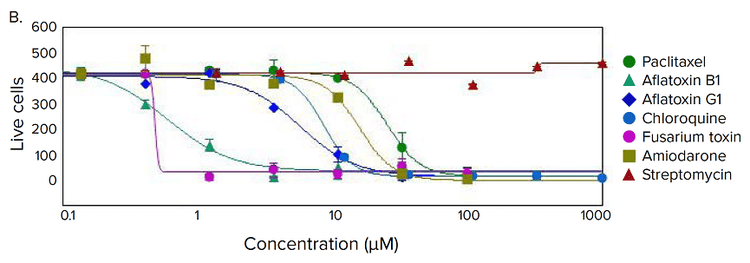
Figure 4. Phenotypic changes in the spheroids after compound treatment. (A) iPSC-derived hepatocyte spheroids treated with increasing concentrations of hepatotoxic compound (amiodarone) and stained with viability markers calcein AM (green), Hoechst (blue), EthD-1 (red). Image analysis masks are shown below the composite images. (B) Dose response curves for selected compounds.
Evaluate toxicity using multiparametric phenotypic screening
Significant changes in spheroid phenotypes and cell content were observed after treatment with various hepatotoxins. Many spheroids lost their spherical shape, appeared disintegrated, “loose”, “flattened”, or “irregular”, had cells detach from the main body, or exhibited condensed nuclei due to cell death. These phenotypic changes in the spheroids after compound treatment occurred over a range of concentrations (Figure 4B). Quantitative analysis of the images included derivation of parameters to assess morphological features of spheroids, cell content, and complexity. The volume, diameter, and fluorescence intensities were measured, along with the number of calcein AM-positive cells (live) and the number of EthD-1- positive cells (dead). Total cell number did not decrease in response to compound effects. Instead, an increase in the number of dead cells and a concentration-dependent decrease in the number of viable cells were observed as a result of compound treatment. Average fluorescent intensity for calcein AM was dramatically reduced for the entire spheroid and individual segmented cells (cell cytoplasm).
For further investigation into the cytotoxicity mechanisms, we evaluated apoptotic phenotype and mitochondria integrity. Activation of apoptosis using caspase 3/7 dye was measured 24 hours after compound treatment. Typical activated caspase 3/7 staining patterns for control cells and those treated with methyl mercury are shown in Figure 2B. Treatment with compounds causing apoptosis resulted in an increase of caspase 3/7 stain intensity and the number of caspase 3/7 positive (apoptotic) cells. Mitochondrial potential was evaluated with MitoTracker Orange dye. Treatment of spheroids with compounds affecting mitochondrial integrity resulted in a dose-dependent decrease in MitoTracker Orange staining intensity (Figure 2C).
Measured features such as the number of live cells, calcein AM fluorescence intensities, and volumes of calcein AM positive cells resulted in significant assay windows and successfully fit into 4-parametric dose-response curve model (Figure 4B). IC50 values (Table 2) were determined using SoftMax® Pro 6 Software (Molecular Devices).
Table 2. IC50 values measured for selected compounds using number of live cells per spheroid as the readout.
Summary
The 3D liver spheroid model combined with high-content 3D assays shows promise as a sensitive and reproducible screening tool for assessing hepatotoxicity. While assay predictivity compared to animal and clinical data still needs to be established, further development of these methods and models will increase their utility for in vitro screening.
References
- Chang, T. T., & Hughes-Fulford, M. (2009). Monolayer and Spheroid Culture of Human Liver Hepatocellular Carcinoma Cell Line Cells Demonstrate Distinct Global Gene Expression Patterns and Functional Phenotypes. Tissue Engineering Part A, 15(3), 559-567.
- Hartung, T. (2009). Toxicology for the twentyfirst century. Nature, 460(7252), 208-212.
- Kunz-Schughart, L. A. (2004). The Use of 3-D Cultures for High-Throughput Screening: The Multicellular Spheroid Model. Journal of Biomolecular Screening, 9(4), 273-285.
- Lu, J., Einhorn, S., Venkatarangan, L., Miller, M., Mann, D. A., Watkins, P. B., & Lecluyse, E. (2015). Morphological and Functional Characterization and Assessment of iPSCDerived Hepatocytes for In Vitro Toxicity Testing. Toxicological Sciences, 147(1), 39-54.
Learn more about the ImageXpress Micro Confocal High-Content Imaging System >>
背景介绍
在发育生物学和组织生物学中,3D细胞球建模方式能够加快转化研究进程,因此越来越受到人们的重视1-3。如何对3D样本进行更高通量的定量分析成为了热门研究课题。
在本实例中,Molecular Devices公司建立 并优化了一种分析方法,能够对人类多能 诱导干细胞来源的3D肝细胞球进行共聚焦 成像和毒性评估(图1)。
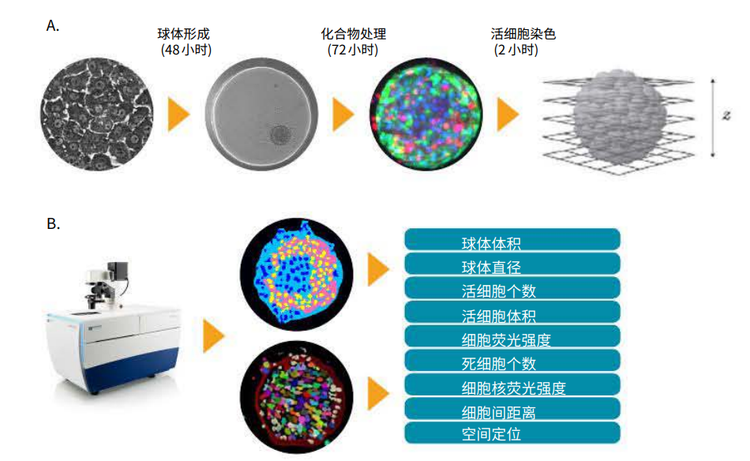
*图 1. 利用人类多能诱导干细胞来源的微组织3D肝脏球进行肝毒性分析 (A)在3D培养之前 iCell肝细胞需要先在2D模式下培养7天,当细胞球形成后,用化合物处理肝脏微组织72小时, 然后染色2小时并采集图像。使用ImageXpress Micro 共聚焦成像系统(ImageXpress Micro Confocal system 对样品进行Z轴层扫 **(B)*利用Z轴层扫得到的图片设置2D和3D图像分割参数,并利用该参数对3D样品核心表型特征进行量化分析 将染料加入细胞球培养体系中孵育2小时,然 后采集图像。染料无需洗脱,加样过程小心 谨慎,避免损伤细胞球进而造成细胞球解体 或偏离原位。典型的细胞球染色结果如图 2 所示。
肝细胞球的形成
本实例使用的细胞为:
- 人类多能诱导干细胞4来源的肝细胞 iCellHepatocytes 2.0 (Cellular Dynamics International) ;
- HepG2细胞 (ATCC) 。
操作流程
- 按照标准操作流程将冻存细胞复苏;
- iCell Hepatocytes 2.0 铺板进行2D培养;
- 、贴壁细胞用Accutase酶消化后与Geltrex质 (ThermoFisher Scientific)混合,细胞混合液 以1000 cells/well的密度种植在低吸附成球孔 板中(InSphero or Corning);
- 将孔板以300 g转速离心2分钟使细胞沉淀 并去掉基质中的气泡,然后将孔板放入细胞培 养箱,在37°C, 5% CO 2 条件下进行培养。培养 HepG2 细胞无需加入基质;
- 培养24‒48小时后细胞球形成。
图 2. 不同标记物对细胞球的染色结果 (A) 分别用 1µM staurosporine(十字孢碱), 30µM ketoconazole(酮康唑)或 30µM haloperidol (氟哌啶醇)处理细胞球72小时,然后用 calcein AM (绿色),Hoechst (蓝色),,EthD-1 (红色) 荧光染 料对细胞球进行染色并成像。 (B) 用CellEvent Caspase 3/7(绿色), EthD-1 (红色),Hoechst (蓝色)荧光染料对细胞球进行染色, 在图中可以清晰地看到细胞凋亡现象。与对照组相比,经过1 µM methyl mercury (甲基汞)处理24小 时的细胞球中凋亡细胞(绿色)的数量大大增加。 (C) 用3 µM antimycin A (抗霉素A) 处理细胞球,然后用 MitoTracker Orange (红色),Hoechst (蓝色) 荧光染料对细胞球进行染色并成像。抗霉素A破坏了线粒体膜的完整性,因此实验组中没有出现线粒 体的染色结果。
高通量3D图像的采集和分析过程
采用ImageXpress Micro 共聚焦高内涵成 像系统(Molecular Devices)采集图片,具 体设置如下:
- 物 镜 种 类⸺10倍镜和20倍镜
- 层 扫 间 距⸺5-10 µm
- 层 扫 范 围⸺100 -120µm
- 层扫起始位置⸺多孔板孔底
所有的结果中都包含有2D maximum投射 图像,分析过程中可以对这些图像进行保 存和调用。
识别并分析3D样品
使用MetaXpress高内涵图像采集分析软件对3D图 像进行分析。CME用户模块编辑器中新增了3D分析 模块(图3) ,该模块能够对3D结构的体积、荧光强 度、距离等参数进行量化并对图像进行批量分析。 其中 “Find Spherical Objects”功能可以对目标 结构的形态学参数(最小和最大宽度,最小和最大 Z轴层数)和目标结构与背景之间荧光强度的差值 进行自定义设置,对不同大小的目标结构(小到细 胞器,大到多细胞团)进行定义。
比如将形态参数设定为:
- 细胞核宽度范围⸺5-15 µm
- 细胞核层数⸺1-2层
- 细胞核与背景的荧光强度差⸺200 荧光单位
- 肝细胞球宽度范围⸺100-300 µm
- 肝细胞球层数⸺5-7层
- 肝细胞球与背景的荧光强度差⸺400 荧光单位
分析结果包括每个目标结构的球体体积、直径(或平均体积、平均直径),以及特定荧光通道中球体的总荧光强度和平均荧光强度等参数。
图 3.利用CME 用户模块编辑器对细胞球进行识别设置好参数后,即可对细胞球进行分析,分析内容包括细胞计数、单细胞表型分析、细胞核分析、特定标记物下细胞质的阳性阴性分析等
“Find Spherical Objects”功能还可用于 识别单个细胞和细胞核或利用适当的特征将 不同的单细胞区别开来。此外,3D分析模块 可以按照用户自定义选项“Connect by Best Match”, “Connect byTouching”, 和 “Do Not Connect Objects”将不同层面 的目标结构连接起来。
首先对Z轴层扫中的每层图片按照2D图片进行分割、分析并得到细胞核个数,细胞死/活和细胞分类等参数的测量值;其次利用用户定义的目标结构的最大范围将其连接起来。如:
- 细胞核最大范围 3-6 µm
- 细胞质最大范围 20-30 µm
最终,在3D结构中将细胞核或单细胞分割出 来。整个过程中目标结构不会丢失也不会被 重复计数。所有的细胞(如:calcein AM 阳 性/阴性细胞;Ethidium homodimer阳性/ 阴性细胞)都会被识别、被计数。
为了直观表现目标结构的整体/平均荧光强 度、体积、直径、间距以及目标结构在三维 空间中的定位等参数,可用不同颜色标记单 个细胞。利用细胞球标记范围( spheroid masking )对更小的结构进行计数,这些结 构可能在标记范围(mask)之中或在标记 范围(mask)之外。如: 对每孔只含有一 个细胞球的样品进行分析时,利用单细胞标 记( single-cell masking) 可以对所有细 胞进行计数并将位于细胞球中和细胞球外的 细胞区别开来。当细胞球不完整时,这种图 形处理方式就显得十分重要。对每孔含有多 个细胞球的样品(细胞球与基质共培养)进 行分析时,这种图形处理方式可以定义每个 细胞球的容量并得出均值。
图 4A 显示了不同层面的2D图像中 calcein AM 阳性细胞的细胞分类结果。利用 “Connect by Best Match” 功能可以将细胞在3D 空间中连接起来。相同的方法可以分析 ethidium homodimer 阳性/阴性细胞(细胞 死/活分析) 也可以分析线粒体、荧光强度、 细胞凋亡还可以分析特定染料和标记物。
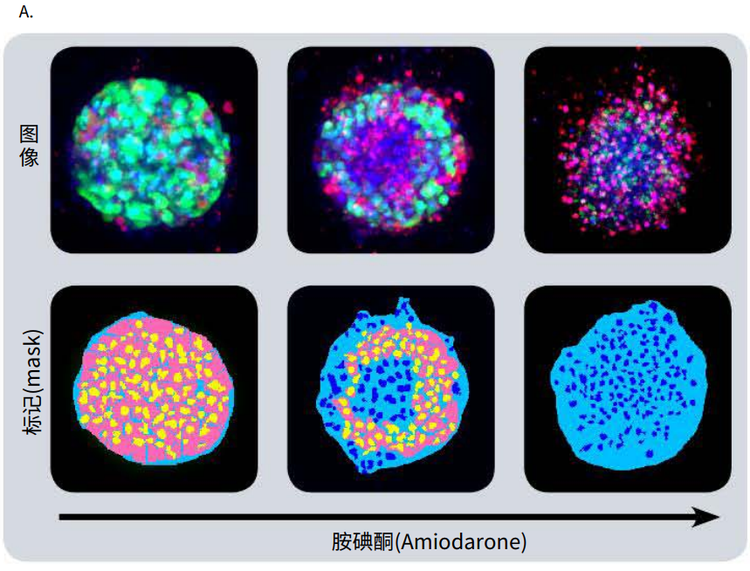
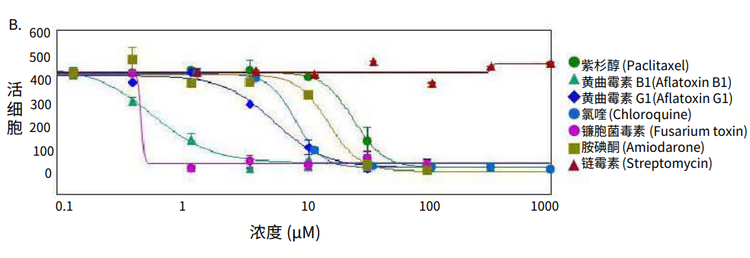
图 4. 化合物处理后细胞球表型的变化 (A)用一定浓度梯度的肝毒素化合物胺碘酮(amiodarone)处理多能诱导干细胞 来源的肝细胞球,然后用 calcein AM (绿色), Hoechst (蓝色), EthD-1 (红色)荧 光染料对细胞球进行染色。图像分析后的mask结果如图所示。 (B) 各个化合物的剂量效应曲线
使用多参数表型筛选结果进行毒性评价
利用多种肝毒素处理细胞球,观察细胞球表型 和细胞含量的显著变化。许多细胞球失去了球 状结构,球体发生崩解,细胞球变得松散、扁 平、不规则。细胞从主体结构中脱离,或出现 凝结核,表明细胞已经死亡。 当化合物浓度 超过一定范围,细胞表型就会出现上述变化 ( 图 4B)。利用图像量化分析得到的参数对细胞 球的形态特征、细胞含量和结构复杂程度进行 评估。检测细胞球体积、直径、荧光强度,同 时检测calcein AM 阳性细胞(活细胞)、EthD-1 阳性细胞(死细胞)个数。细胞球经化合物处 理后,细胞总数没有变化,死细胞数量上升, 活细胞数量下降(具有浓度依赖特性);细胞 球和单个细胞(细胞质)中calcein AM的平均 荧光强度显著降低。
为进一步研究细胞毒性机制, 我们对细胞的 凋亡特征和线粒体完整性进行评估。化合物处 理细胞球24小时后,用caspase 3/7 荧光染料 检测细胞凋亡的活化程度。 caspase 3/7 对细 胞球(经甲基汞处理的对照组细胞球)的染色 结果如图2B所示。用化合物处理细胞球后会 诱导细胞凋亡,导致 caspase 3/7 荧光强度增 加,caspase 3/7 阳性细胞(凋亡细胞)的个 数增加。 用MitoTracker Orange 荧光染料染 色结果来反映线粒体膜电位的变化情况。用化 合物处理细胞球后会破坏线粒体结构的完整, 进而导致MitoTracker Orange荧光强度降低 (具有浓度依赖特性,图2C )
对活细胞个数、calcein AM 荧光强度、calcein AM 阳性细胞含量等参数进行测量后发现这些 参数都非常符合四参数剂量反应曲线模型(图 4B)。IC50 值 (表 2) 由SoftMax Pro 6 软件(Molecular Devices)生成。
表 2. 以每个细胞球中活细胞个数为参数,测量筛选化合物的IC50值
总结
参考文献
- Chang, T. T., & Hughes-Fulford, M. (2009). Monolayer and Spheroid Culture of Human Liver Hepatocellular Carcinoma Cell Line Cells Demonstrate Distinct Global Gene Expression Patterns and Functional Phenotypes. Tissue Engineering Part A, 15(3), 559-567.
- Hartung, T. (2009). Toxicology for the twentyfirst century. Nature, 460(7252), 208-212.
- Kunz-Schughart, L. A. (2004). The Use of 3-D Cultures for High-Throughput Screening: The Multicellular Spheroid Model. Journal of Biomolecular Screening, 9(4), 273-285.
- Lu, J., Einhorn, S., Venkatarangan, L., Miller, M., Mann, D. A., Watkins, P. B., & Lecluyse, E. (2015). Morphological and Functional Characterization and Assessment of iPSCDerived Hepatocytes for In Vitro Toxicity Testing. Toxicological Sciences, 147(1), 39-54.
在对肝毒性进行评价的过程中,3d肝脏球模型+高内涵3d分析模式作为一种反应灵敏、可重复性高的方法,越来越展现出广阔的应用前景。该方法预测准确率相比于动物实验和临床数据仍需要继续完善。相关模型的进一步发展,检测方法的进一步优化有利于拓展该方法在体外筛选领域中的应用空间。
Learn more about the ImageXpress Micro Confocal High-Content Imaging System >>