
Cell Counter
At the Cell Counter: NIH3T3 Cells
Established in 1963 by scientists George Todardo and Howard Green, the NIH3T3 cell line was derived from mouse embryonic fibroblasts. The cells spontaneously immortalized and were named after their culturing protocol, “3-day transfer, inoculum 3x10⁵ cells”. Now the standard fibroblast cell line, they are known as excellent transfection hosts and as models for induced stem cell pluripotency experiments. They are also useful as feeder cells in human embryonic stem cell research and are often used for culturing keratinocytes, as the growth factors from NIH3T3 are favorable to keratinocyte growth.
The elongated structure and variable cell size of NIH3T3 can pose difficulties for image analysis. However, using StainFree technology, we are able to count these irregular-shaped cells with great accuracy.
View StainFree Cell Detection Webinar
Download StainFree Cell Detection Application Note
Download eBook: Count Cells Like a Pro
Figure 1. StainFree analysis of NIH3T3 cells
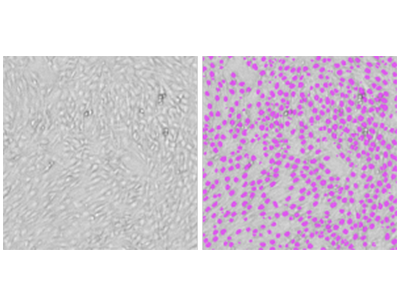
NIH3T3 cells were imaged using the SpectraMax MiniMax 300 Imaging Cytometer, and cells were identified using the predefined ‘CellsB’ analysis setting. Shown on the left is the original transmitted light image, and on the right is the same image with purple masks indicating cells identified by the software.
Figure 2: Cell counts of NIH3T3 cells
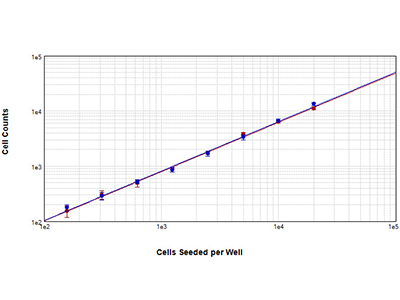
NIH3T3 cells were seeded in a 1:2 dilution series in a 96-well plate. The cells were fixed and stained with a nuclear dye. Following staining, the SpectraMax MiniMax 300 Imaging Cytometer was used to count cells using either the nuclear red staining (red curve) or StainFree™ Cell DetectionTechnology (blue curve) as the basis for cell identification. Both counting methods yield nearly identical results, and both curves have r2 > 0.99.
Figure 3. NIH3T3 cells stained
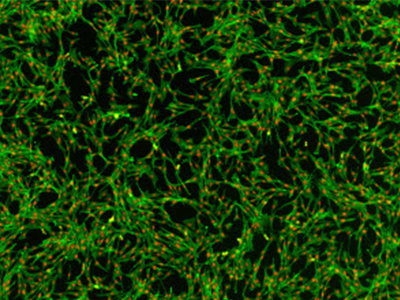
NIH3T3 cells stained with AlexaFluor 488-phalloidin and red nuclear dye. Cells were imaged on the SpectraMax MiniMax 300 Imaging Cytometer.
Tip:
For many NIH3T3 cultures, you can easily count cells using one of the predefined settings in SoftMax Pro Software. Either the ‘CellsB’ or ‘CellsD’ setting may be used. Alternatively, you can use the drawing tools to create a new, custom setting suitable for your particular cells. To avoid problems posed by the cells’ irregular shape and tendency to cluster, you can draw slightly within the outlines of a cell of interest. To prevent potential over-counting caused by the long processes on these cells, simply draw on the processes with the background tool to prevent them from being counted as separate cells.
NIH3T3 Cells Analysis Toolkit
- SpectraMax® i3 Multi-Mode Microplate Detection Platform
- SpectraMax® MiniMax™ 300 Imaging Cytometer
- SoftMax® Pro Software
Instrument Settings
About StainFree Cell Detection Technology
Imaging cell-based assays typically requires the use of fluorescent probes that can be toxic to living cells or may only function in fixed cells. A label-free method for analyzing cell counts and cell confluence enables researchers to quantitatively monitor cell proliferation and health without time-consuming workflows that may disrupt cell viability.
The SpectraMax i3 Multi-Mode Microplate Platform with MiniMax 300 Imaging Cytometer uses unique, patent-pending StainFree Cell Detection Technology that allows you to perform cell proliferation, cytotoxicity, and other assays without nuclear stains like DAPI, which intercalates with DNA, or live cell dyes that are actually toxic to cells in the long term.