
Application Note
Visualize subcellular vesicles to quantitate autophagy in neuronal cells
- Generate accurate segmentation of unlabeled neurites
- Gain deeper insights into mechanisms of neurodegenerative disease
- Discriminate with more precision between similar subcellular structures
- Measure multiple biologies in a single well to generate rich data
Jayne Hesley, PhD | Sr. Applications Scientist | Molecular Devices
Autophagy as a potential area of therapeutic intervention
Autophagy is an intracellular catabolic process that sequesters and degrades proteins and organelles that have either been recognized as faulty or are simply no longer needed by the cell. Autophagy supports normal cellular processes by carrying out the “housekeeping” function of removing invasive microorganisms, misfolded proteins, and degraded organelles. Autophagy is essential to the maintenance of cell homeostasis and, in addition to its role as a mechanism of cell material turnover, autophagy supports the response of an organism to challenges such as starvation by adjusting rates of energy consumption and material re-utilization.
Both beneficial and harmful roles for autophagy have been discovered in cancer, infectious disease, diabetes, neurodegenerative disease, and other conditions. The role of autophagy is of particular interest in the study of neuronal cells, where it helps to maintain protein structure and function over long axonal distances. Unlike the cells of other tissues, the cytosolic contents of neurons are not routinely diluted by mitosis. Altered autophagy and accumulation of cellular toxins are seen in Alzheimer’s disease, Parkinson’s disease, and other neurological disorders.2 These observations have led to the consideration of the various mechanisms of autophagy as potential areas of therapeutic interventions. Quantitation of the effects of experimental variables on this process is an essential element of research that may lead to the development of safe and effective treatments targeting autophagy.
Materials
- CYTO-ID ® Autophagy Reagent (Enzo Life Sciences)
- Fluorescent lysosomal dye
- iCell ® human-induced pluripotent stem cell-derived neurons (Cellular Dynamics International)
- Rat PC-12 cells (ATCC, cat no. CRL-1721)
- ImageXpress ® Micro High-Content Imaging System (Molecular Devices)
- MetaXpress ® High-Content Image Acquisition and Analysis Software (Molecular Devices)
Visualize autophagy using fluorescence imaging
Autophagy can be visualized and characterized even in heterogeneous cell populations using readily available reagents.
CYTO-ID Autophagy Reagent selectively stains the membranes of phagophores, autophagosomes, and autolysosomes. It has also been shown to co-localize with the autophagosome protein LC3-II. It has a fluorescence excitation/emission profile of 495/519 nm and can be used with a standard FITC filter set.
Destructive autophagosome fusions with lysosomes can be detected with the aid of lysosome-specific fluorescent visualization (Figure 1). In the examples that follow, a fluorescent lysosomal dye, with excitation/emission wavelengths of 647/668 nm was used to characterize lysosomal activity. A standard Cy5 filter set can be used to detect emissions from the deep red lysosomal dye.
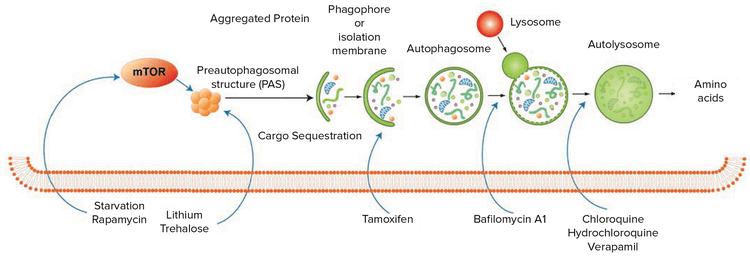
Figure 1: The process of autophagy begins when an internal or external signal promotes the formation of a phagophore, a spherical double-membrane sequestering structure. Microtubule-associated protein 1 light chain 3 alpha (LC3) stimulates elongation of the phagophore, which begins to engulf cytoplasmic targets. In a process mediated by autophagy-related (ATG) proteins, the phagophore closes around the targets to become an autophagosome. The autophagosome then fuses with a lysosome, exposing its contents and its own membrane to degradation by hydrolytic enzymes.1
Enable simultaneous analysis of phenotypic changes
The level of CYTO-ID Green staining of autophagosomes and lysosome staining in live cells provides information about the mechanism of a compound’s stimulation or inhibition of the autophagy pathway. This was accomplished using the ImageXpress Micro system, a high-content screening system for widefield fluorescence or brightfield imaging of fixed or live cells, tissues, and small organisms (Figure 2).

Figure 2. Simplified quantitation workflow using automated imaging. The straightforward and automated workflow is amenable to high-throughput screening with minimal hands-on time required even for an experiment that may take days from plating to end results.
MetaXpress software analyzed images using preconfigured applications or customized modules to characterize phenotypic changes and produce specific outputs. A custom module enabled the simultaneous detection, measurement and area summation of multiple stained bodies, such as nuclei, autophagosomes, and lysosomes. Measured values were plotted over time or against experimental conditions such as a range of drug compound concentrations.
Increased quantity of autophagosomes indicates cell distress
iCell human-induced pluripotent stem cell (iPSC) derived neurons and rat PC-12 cells were used to demonstrate the utility of testing for multiple cellular responses in each well of a 384-well microplate.
Human neurons
Neurons were plated at 5,000 cells/well and grown as following the manufacturer’s recommendations. After 5 days, cells were treated with a dilution series of compounds prepared in maintenance media. After 24 hours of compound incubation, staining for lysosomes, nuclei and autophagosomes was performed and live cells were imaged using ImageXpress Micro system with the chamber heated to 37°C. Images were acquired from 2–4 sites per well using either a 60X Plan Fluor or 40X Plan Apo objective (Figure 3A). Image analysis was accomplished using MetaXpress software to quantitate the effects of exposure to experimental compounds over a range of concentrations (Figure 3B). While example images show cells at 60X magnification for illustrative purposes, the data in the graphs in Figures 3–6 are from the same experiments but utilizing 40X magnification. The lower magnification produces images of sufficient quality for measurement of intracellular vesicles while offering the benefit of capturing more cells within each field of view.

***Figure 3. *Quantification of effects of exposure to experimental compounds on human neurons. (A) Representative 60X magnification images of human neurons following exposure to three different compounds at three different concentrations. Autophagosomes (green) respond to the cell treatment in a dose-dependent manner. (B) Dose-response effect of chloroquine, rotenone, and verapamil on aggregate autophagosome area in human neurons. Autophagosomes may be inhibited or stimulated by compound exposure.
Rat PC-12 cells
PC-12 cells were plated at 2,000 cells/well and cultured overnight before treatment with a dilution series of compounds prepared in complete media. After 24 hours, staining for lysosomes, nuclei and autophagosomes was performed and live cells were imaged at 37°C. Images were acquired from 2–4 sites per well at 40X magnification. Image analysis was accomplished using MetaXpress software to quantitate the effects of exposure to experimental compounds over a range of concentrations (Figure 4).

***Figure 4. *Quantification of effects of exposure to experimental compounds on rat PC-12 cells. (A) Representative 60X magnification images of rat PC-12 cells following exposure to three different compounds at three different concentrations. Autophagosomes (green) can be clearly visualized and measured. (B) Dose-response effect of chloroquine, rotenone, and verapamil on aggregate autophagosome area in rat PC-12 cells. Autophagosomes may be inhibited or stimulated by compound exposure.
Lysosomal response indicates disruption in the autophagic pathway
Human neurons
The assay for lysosomes was conducted in the same wells and with the same procedure as that described previously but with the addition of the lysosomal dye (Figure 5).

***Figure 5. *Quantification of lysosomal response in human neurons. (A) Representative images of iPSC derived neurons following exposure to three different compounds at three different concentrations. Lysosomes (red) can be visualized and measured to detect responses. (B) Dose-response effect of chloroquine, rotenone, and verapamil on total lysosome area, a second measure of autophagy, in neurons. Lysosomal measurements can indicate disruption of the autophagosome pathway at the final step of fusion of the two vesicles.
Rat PC-12 cells
The same assay for measuring multiple toxic events was conducted in PC-12 cells. Several parameters were measured to determine effect on intracellular lysosomes (Figure 6).

***Figure 6. *Quantification of lysosomal response in rat PC-12 cells. (A) Representative images of rat PC-12 cells following exposure to three different compounds at three different concentrations. Above images were acquired using a 60X PF objective. Lysosomes are shown in red. Quantitating the decrease or increase in intracellular lysosomes gives clues to the compound’s mechanism of toxicity. (B) Dose-response effect of chloroquine, rotenone, and verapamil on aggregate lysosome area, a second measure of autophagy, in rat PC-12 cells. Lysosomes may be inhibited or stimulated by compound exposure.
Generate accurate neuron segmentation using transmitted light images
It can be challenging to detect autophagosomes that are in the neurite outgrowths, away from the cell body. Obtaining a brightfield image of a non-stained cell body aids in segmenting cells with long processes. A custom module was constructed in order to accurately quantitate only stained organelles associated with a neuron. This assured the detection of only cellular objects-of-interest and not stained artifacts or debris (Figure 7).

***Figure 7. *Neuron segmentation using a custom module. (Left) Overlay of zoomed 40X magnification images of transmitted light (grey), Hoechst-stained nuclei (blue), and CYTO-ID stained autophagosomes (green). (Right) Segmentation mask with cell bodies and outgrowths identified in teal from the transmitted light image, healthy nuclei identified as yellow, apoptotic nuclei identified as pink, and autophagosomes identified by royal blue. Autophagosomes can be counted even if located far from the cell body (as pointed out by the arrows).
Dose-response curves for the readouts generated from the custom module analysis were created in the AcuityXpress™ Analysis Software (Figure 8). A clear dose-dependent response for autophagosome formation was noted for both verapamil and chloroquine. EC50 values for compound inhibition or stimulation of autophagy, as noted by autophagosome and lysosome formation, were listed in Figure 9.

***Figure 8. *Dose response curves of autophagosome formation for Verapamil and Chloroquine. Images were analyzed using a Custom Module as defined in Figure 7 and the measurements generated were used to plot the curves in AcuityXpress Analysis Software.
EC
50
***Figure 9. *EC50 values for tested compounds. EC50 values were calculated for compounds that either inhibited or stimulated autophagy by fitting the dose response curves to a non-linear model. It was not unexpected for different cell types to display different sensitivities to drug exposure.
Conclusion
We demonstrated the ability to assess autophagy in specific neuronal cell cultures relative to experimental conditions. This offers researchers the opportunity to examine dose-response effects of experimental compounds on neuronal autophagy or to screen libraries of compounds that may affect autophagy and therefore neuronal physiological mechanisms relevant to neurodegenerative diseases.
The ImageXpress Micro system offers a set of features, including widefield high-resolution brightfield and multiple-wavelength fluorescence microscopy, that enabled the capture of images of human and rat neuronal cells cultured in 384-well microplates. MetaXpress software was able to analyze these images and chart the relationships between experimental conditions and the occurrence of autophagy, as quantified by the measured aggregate areas for autophagosomes, lysosomes, and other visualized cellular components.
References
- Mizushima, Yoshimori and Levine (2010) Methods in Mammalian Autophagy Research. Cell 140:313-326.
- Jin H. Son, et. al. (2012) Neuronal autophagy and neurodegenerative diseases. Experimental and Molecular Medicine 44, 2:89-98.