
Application Note
Phenotypic characterization of toxic compound effects on cardiomyocytes derived from induced pluripotent stem cells
- Assess cardiotoxicity effects using automated imaging
- Determine cell viability and cardiotoxicity using quantitative image analysis
- Evaluate concentration response of compound cardiotoxicity
Oksana Sirenko, PhD | Research Scientist | Molecular Devices | Sunnyvale, CA
Introduction
Cardiotoxicity remains a primary cause for drug attrition during clinical trials and post-marketing1. While it is believed that a significant percentage of cardiovascular diseases are due to environmental exposures, identities of the causative environmental agents remain largely uncharacterized2. Accordingly, an important target area for assay development for in vitro screening includes the detection of potential cardiotoxic effects.
As an alternative to primary cardiomyocytes and myocardial tissue preparations, human induced pluripotent stem cell (iPSC)-derived in vitro model systems have emerged as a physiologically-relevant and highly reproducible option for cardiotoxicity testing3, 4. iPSC-derived cardiomyocytes are an attractive in vitro model. They form a synchronously beating monolayer that reliably reproduces drug-associated cardio-physiologic phenotypes, which can be assessed by a fast kinetic fluorescence assay that monitors changes in intracellular Ca2+ flux5. The evaluation of changes in beating profiles is very important for detection of functional effects and high-content imaging is an essential complimentary assay for monitoring morphological changes and cytotoxicity effects of compounds.
Materials
- ImageXpress Nano Automated Imaging System with CellReporterXpress Automated Image Acquisition and Analysis Software (Molecular Devices)
- iCell ® cardiomyocytes (Cellular Dynamics International)
- AFF88-conjugated Phalloidin (ThermoFisher Scientific)
- MitoTracker Orange (ThermoFisher Scientific)
- Hoechst (ThermoFisher Scientific)
- 384-well microplate (Corning Life Sciences)
Methods
In this study, we evaluated the efficiency of the ImageXpress® Nano Automated Imaging System for high-throughput screening assays using stem cell derived cardiomyocytes. The iPSC-derived cardiomyocytes were used for testing a panel of pharmaceutical drugs and environmental chemicals that have been associated with cardiotoxicity. Human iPSC-derived cardiomyocytes (iCell® cardiomyocytes), plating medium, and maintenance medium were provided by Cellular Dynamics International. Cells were plated and maintained according to the manufacturer’s recommendations6. Cells were plated into gelatin-coated wells at 8,000 cells/well in 384-well plates. Synchronous contractions of the monolayer of cardiac cells were evident after 5-7 days of culture.
Cardiotoxicity assessment using automated imaging
To evaluate cardiac toxicity, cells were treated with various cardiotoxic compounds for 24h, and then live cells were stained with Calcein AM to assess viability, Hoechst 33342 to detect nuclei, and MitoTracker orange dye for detection of intact mitochondria (final concentrations 0.5 μM, 2 μM, and 1 μM respectively). Images were acquired using the ImageXpress Nano system and were processed and quantified using the Cell Scoring or Cell Viability application modules with CellReporterXpress™ Automated Image Acquisition and Analysis Software. Readouts included nuclei count and intensity for Hoechst 33342, percent of live cells and total area of live cells positive for Calcein AM staining, and the number of cells positive for MitoTracker Orange dye.
After live cell imaging, cells were fixed with 4% formaldehyde and re-stained with AF-488 Phalloidin (1:100 dilutions) in order to examine cytoskeleton integrity of cells. Images were analyzed using the Cell Scoring algorithm to quantify total and average areas of cardiac cells, as well as the number and percentage of cells with intact cytoskeleton. Compounds were tested in duplicates at 0.3, 1.0, 3.0, 10, 30, and 100 μM. DMSO controls (n = 12) and untreated controls (n = 4) were included in each plate. Up to 0.3% DMSO was used to assess solvent effects within the assay. Cells were exposed to compounds for 24h at 37°C and 5% CO2. Details regarding optimization of plating density in 384-well format are described in detail in Grimm et al.4.
Images were acquired using a 10x Plan Fluor objective. One 10x image was captured per well in a 384-well plate. A 10x objective provides sufficient resolution to distinguish cytoskeletal organization, cellular junctions, such as intercalated discs, and sub-cellular structures, while still capturing a relatively large number of cells within the well. Up to 2,000 cells can be captured with a single field of view (1.28 x 1.28 mm) at 10x, which represents about 1/4 of the total well area (2.67 x 2.67 mm). Figure 1 displays examples of image processing from representative images of control and compound treated cells.
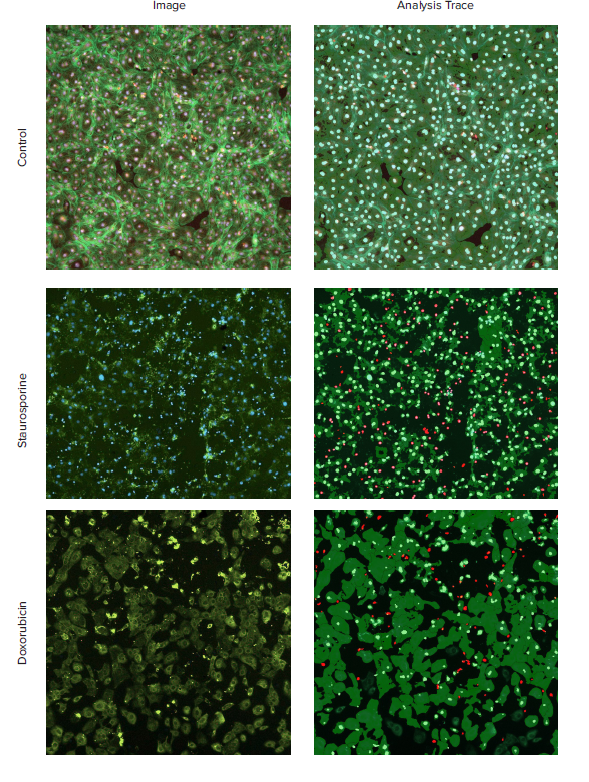
Figure 1. Cytoskeleton staining of cardiomyocytes for visualization of cardiotoxicity. iCell Cardiomyocytes were plated and treated with compounds for 24h and stained with a combination of Hoechst (2 μM), MitoTracker Orange (1 μM), and then fixed and stained with AF488-conjugated Phalloidin (1:100). Images were taken by ImageXpress Nano system, using a 10x Plan Fluor objective, and DAPI, TRITC, and FITC channels. Images were processed using the Cell Scoring analysis algorithm. Composite images of actin, Hoechst, MitoTracker Orange (Left) and the analysis traces (Right) are shown for the control and selected compound treated cells. Disruption of the cytoskeleton and cell death was observed for cardiomyocytes treated with indicated compounds (Staurosporine, 1 μM and doxorubicin, 10 μM).
Quantitative image analysis for determination of cell viability and cardiotoxicity
We have observed an impact of selected compounds on the numbers of viable (Calcein AM positive or AF-488 positive) cells (Figure 2). Quantitative analysis of the images included derivation of other parameters that allow for the assessment of the cytoskeleton or mitochondria integrity, as well as the areas of adherent cells. Specifically, morphological changes (e.g. reduction of cell area) were observed (i.e. deltamethrin, astemizole). Decrease of nuclear area and increase of nuclear intensity was observed for staurosporine (indication of apoptosis). Decrease of MitoTracker Orange staining was also observed for compounds showing cytotoxicity. The toxic effects of compounds were evaluated by EC50 values (concentration of compound for 50% decrease of cells positive for Calcein AM or Phalloidin) derived from 4-parametric curve fits for the number of viable cells or total cell area. Other parameters showed concentration-dependent changes at higher concentrations, but did not have reliable fits in the 4-parameter curve.
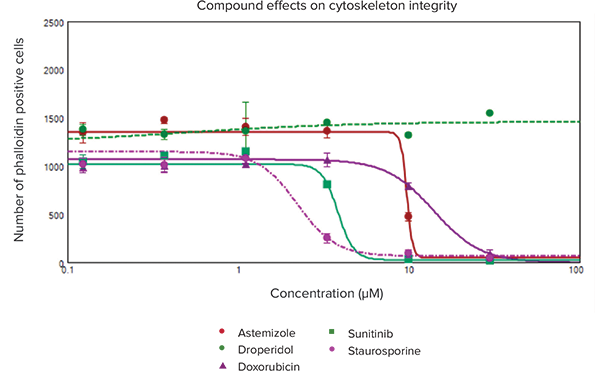
Figure 2. Dose-response curves of viable cardiomyocytes stained by Phalloidin. Cell viability was determined by analyzing the cytotoxic effects on cytoskeleton integrity induced by compound treatments. Observations of the total number of viable cells, staining positive for Phalloidin (actin stained green), were quantitated using the Cell Scoring analysis algorithm in CellReporterXpress software. Concentration-dependent response curves were plotted with 4-parameter curve fits to obtain EC50 values which are included in Table 1.
Concentration-response evaluation of compound cardiotoxicity
The EC50 values for compound effects are presented in Table 1. Among the 22 tested compounds, nine decreased cell viability, as well as the total area. Valinomycin and rotenone had the strongest toxicity effects as determined by the total number of live cells (EC50 value was < 1 μM). Methyl mercury and tetraethyl thiuram disulfide also proved to have strong toxicity effects (EC50 value was 3 μM and 15 μM respectively). Several drugs (staurosporine, sunitinib, astemizole, doxorubicin, and berberine chloride) with known cardiotoxic effects also had relatively significant toxicity effects with EC50 values in the 1-15 μM range. Deltamethrin and toluene had relatively minor effects (EC50 values were not determined). Other tested compounds showed no cytotoxic effects.
Compounds ( EC
50
value, μM)
1.29
*
no effect
**
>100
***
* EC50 values (in μM) measured for tested compounds using the number of cells with intact cytoskeleton or total area as readout.\ ** “>100” means that toxic effects (decrease of number of positive cells or total cell area) were observed at the highest concentration tested (100 μM), but EC50 values were not determined.\ *** “No effect” means that no apparent effects were observed at the highest concentrations tested (100 μM).
Table 1. EC50 values for cytotoxic effects measured for tested compounds. EC50 values were created based on the Hill model from dose-dependent response curves plotted with 4-parameter curve fits. Curves were created for the total number and total area of phalloidin-positive cells (viable cells).
Summary
The assay demonstrates the efficiency and reliability of the ImageXpress Nano system and CellReporterXpress software for the high-throughput screening of multiple chemicals for cardiotoxicity. This screening tool would allow the identification of cardiotoxic drugs early in drug development and provide a reliable tool for testing potential drug cartiotoxicity effects in humans.
References
- Berridge BR, Hoffmann P, Turk JR, Sellke F, Gintant G, Hirkaler G, Dreher K, Schultze AE, Walker D, Edmunds N, Halpern W, Falls J, Sanders M, Pettit SD. Integrated and translational nonclinical in vivo cardiovascular risk assessment: Gaps and opportunities. (2013) Regul Toxicol Pharmacol 65:38-46
- Pruss-Ustun A, Corvalan C. Preventing disease through healthy environments: Towards an estimate of the environmental burden of disease. (2006). Geneva, Switzerland:World Health Organization
- Anson BD, Kolaja KL, Kamp TJ. Opportunities for use of human ips cells in predictive toxicology. (2011) Clin Pharmacol Ther 89:754-758
- Grimm FA, Iwata Y, Sirenko O, Bittner M, Rusyn I. High-content assay multiplexing for toxicity screening in induced pluripotent stem cell-derived cardiomyocytes and hepatocytes. (2015) Assay Drug Dev Technol 13:529-546
- Guo L, Abrams RM, Babiarz JE, Cohen JD, Kameoka S, Sanders MJ, Chiao E, Kolaja KL. Estimating the risk of drug-induced proarrhythmia using human induced pluripotent stem cell-derived cardiomyocytes. (2011) Toxicol Sci 123:281-289
- Sirenko O, Cromwell EF, Crittenden C, Wignall JA, Wright FA, Rusyn I. Assessment of beating parameters in human induced pluripotent stem cells enables quantitative in vitro screening for cardiotoxicity. (2013b) Toxicol Appl Pharmacol 273:500-507