
Cell Counter
At the Cell Counter: Rat Aortic Endothelial Cells
Rat aortic endothelial cells have been used in a variety of scientific studies including cell-cell adhesion, migration, angiogenesis, and the investigation of cellular signaling pathways involved in endothelial function under normal and disease conditions. Since they are primary cells, their use in drug screening can be tricky. Live cell imaging and measurement of cell confluence prior to running an assay can be critical to success.
View StainFree Cell Detection Webinar
Download StainFree Cell Detection Application Note
Download eBook: Count Cells Like a Pro
Figure 1. Transmitted light image of rat aortic endothelial cells
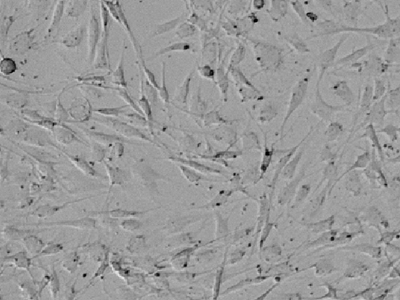
Image shows the range of morphologies and cellular processes within a single primary culture.
Figure 2. StainFree counting of rat aortic endothelial cells
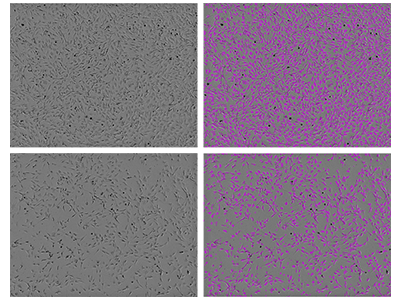
Rat aortic endothelial cells were imaged using the SpectraMax i3 MiniMax 300 Imaging Cytometer, and cells were identified using a custom analysis setting. Shown on the left are the original transmitted light images (top, higher density culture; bottom, lower density culture), and on the right are the same images with purple masks indicating cells identified by the software.
Images were generously provided by Dr. Virginia Huxley at the University of Missouri, Columbia, MO, with assistance from our field application scientist, Randy Milano.
Tip:
Imaging cytometry of rat aortic endothelial cells can pose challenges because they are quite flat, display a multitude of different morphologies, and sometimes even have long processes reminiscent of neuronal outgrowths as shown in Figure 1. This is where the supervised machine learning algorithm used in StainFree Technology really comes in handy. In the image analysis settings, choose the option ‘Create New Setting’ and focus your drawing on the core of the cells, ignoring the cellular processes (outgrowths). Be sure to include a few representative cells of different morphologies, and you will get results like those in Figure 2.
Helpful hint: setting the Focus Adjustment to a more negative value can give more distinct images of these cells that are easier for the software to count.
Rat Aortic Endothelial Cells Analysis Toolkit
- SpectraMax ® i3 Multi-Mode Microplate Detection Platform
- SpectraMax ® MiniMax™ 300 Imaging Cytometer
- SoftMax ® Pro Software
Instrument Settings
Exposure: 7 ms
Focus adjustment: -455 µm (may be optimized based on characteristics of the cells used)
Analysis type: Discrete Object Analysis
Wavelength for finding objects: TL
About StainFree Cell Detection Technology
Imaging cell-based assays typically requires the use of fluorescent probes that can be toxic to living cells or may only function in fixed cells. A label-free method for analyzing cell counts and cell confluence enables researchers to quantitatively monitor cell proliferation and health without time-consuming workflows that may disrupt cell viability.
The SpectraMax i3 Multi-Mode Microplate Platform with MiniMax 300 Imaging Cytometer uses unique, patent-pending StainFree Cell Detection Technology that allows you to perform cell proliferation, cytotoxicity, and other assays without nuclear stains like DAPI, which intercalates with DNA, or live cell dyes that are actually toxic to cells in the long term.