
Cell Counter
At the Cell Counter: HT1080 Cells
The fibrosarcoma cell line HT1080 was generated in 1972 from tumor biopsy tissue. Interestingly, the patient had not been treated with radiation or chemotherapy at the time of biopsy, so the cells lack the sort of unwanted mutations that are commonly caused by these treatments. Because HT1080 cells are highly invasive, they are often used as models for cell invasion and migration. Researchers have been able to identify a number of potential therapeutic agents for cancer on the basis of their ability to inhibit the invasive behavior of HT1080 cells.
View StainFree Cell Detection Webinar
Download StainFree Cell Detection Application Note
Download eBook: Count Cells Like a Pro
Figure 1: Imaging cell migration
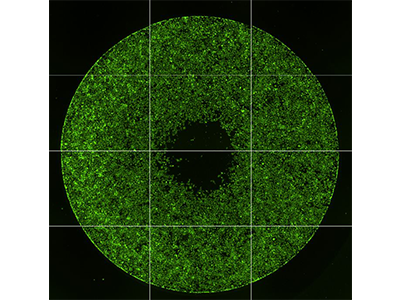
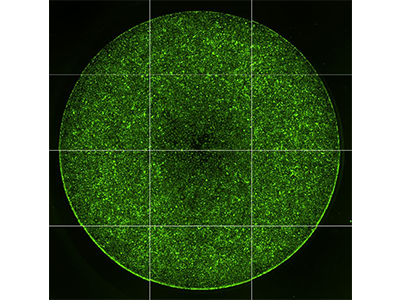
The Oris™ Pro Cell Migration Assay from Platypus Technologies was used to measure migration of HT1080 cells treated with cytochalasin D (left) or DMSO control (right). This assay uses a non-toxic biocompatible gel (BCG) to form a cell-free zone on culture surfaces. After seeding cells into the 96-well plate, the BCG dissolves permitting cells to migrate into the well centers (area indicated by yellow circles). The results were imaged on the SpectraMax MiniMax 300 Imaging Cytometer, and cells that had migrated in the well centers were counted using the region of interest (ROI) selection feature in SoftMax Pro Software.
Figure 2: StainFree cell counts
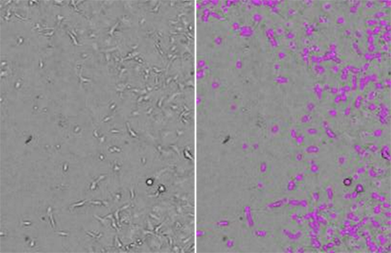
HT1080 cells were imaged using the SpectraMax MiniMax 300 Imaging Cytometer, and cells were identified using the predefined ‘CellsD’ analysis setting. Shown on the left is the original transmitted light image, and on the right is the same image with purple masks indicating cells identified by the software.
Figure 3: Quantifying cell migration
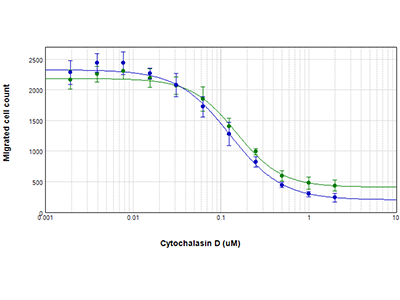
Cells were treated with cytochalasin D, and cells that subsequently migrated into well centers were counted using StainFree Technology (blue circles) or fluorescent cell analysis (green circles). EC50 values for cytochalasin D were 0.13 µM and 0.15 µM, respectively, confirming that cells need not be stained in order to accurately assess cell migration with the Oris Pro Assay.
HT1080 Cells Analysis Toolkit
- SpectraMax ® i3 Multi-Mode Microplate Detection Platform
- SpectraMax ® MiniMax™ 300 Imaging Cytometer
- SoftMax ® Pro Software
Instrument Settings
Analysis type: Discrete Object Analysis
Wavelength for finding objects: TL
About StainFree Cell Detection Technology
Imaging cell-based assays typically requires the use of fluorescent probes that can be toxic to living cells or may only function in fixed cells. A label-free method for analyzing cell counts and cell confluence enables researchers to quantitatively monitor cell proliferation and health without time-consuming workflows that may disrupt cell viability.
The SpectraMax i3 Multi-Mode Microplate Platform with MiniMax 300 Imaging Cytometer uses unique, patent-pending StainFree Cell Detection Technology that allows you to perform cell proliferation, cytotoxicity, and other assays without nuclear stains like DAPI, which intercalates with DNA, or live cell dyes that are actually toxic to cells in the long term.