MetaXpress High-Content Image Acquisition and Analysis Software
Multi-level analysis tools for a wide range of applications optimized for ImageXpress instruments
High-content image analysis software featuring time lapse analysis
MetaXpress® High-Content Image Acquisition and Analysis Software is a comprehensive solution for high-content analysis featuring a tightly orchestrated and integrated workflow. The portfolio of application modules supports a range of needs from ease-of-use through to proprietary assay design. The software includes powerful and elegant tools for 2D and 3D imaging such as time lapse analysis. With the assistance of our acquisition setup wizard, you’ll be generating data in minutes.

Acquire and analyze in 2D and 3D
MetaXpress software is a platform for 2D and 3D image acquisition and analysis. The 3D Image Analysis Module can analyze spheroids, microtissues, cells in a 3D matrix, and small organisms.

Streamline image analysis
The modular toolbox allows for the quick setup of hundreds of routinely used high-content assays. Choose from our optional selections of turnkey application modules for greater convenience.

Design custom analyses easily
Quickly create multi-step routines with the Custom Module Editor. It enables advanced analyses such as identifying objects within objects, and creating morphometric classifiers for shape analysis.
Features

Z-stacks and 3D volumetric analysis
The integrated acquisition and analysis application modules for 3D cell models simplify high-throughput quantification of 3D structures with volume, intensity, and distance measurements.

Fast acquisition and analysis
Easily captures fast biological functions with our patented fast frame rate that can capture 50 frames per second. A 1-color, 384-well plate analysis can be performed in as little as six minutes.

Intelligent segmentation
Application modules feature turnkey image segmentation for label-free and fluorescently labeled images. The Custom Module Editor offers advanced tools for improved segmentation.

Scalable parallel processing
MetaXpress PowerCore™ Software runs analysis routines in minutes. This optional module leverages the power of parallel processing to accelerate analysis.

Data management solution
MDCStore™ Data Manager, included with MetaXpress software, organizes images, experimental information, and data analysis. It enables seamless manipulation of complex sets of images and metadata.

Advanced informatics
AcuityXpress™ High-Content Informatics Software is an optional enterprise level platform for advanced data mining, analysis, statistics, and visualization. It shares the MDCStore database for seamless integration.
Turnkey solutions for most common analysis routines
MetaXpress Application Modules
Expedite image analysis and data processing using our MetaXpress software with application modules that allow you to quickly and easily analyze your data:
- Micronuclei
- Neurite Outgrowth
- Angiogenesis Tube Formation
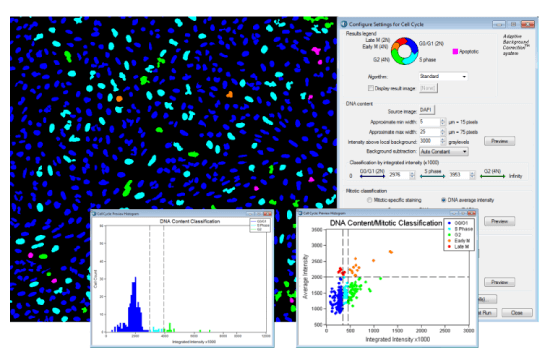
- Mitotic Index
- Plus many more applications...