Advanced Cloud-Based Analytics with StratoMineR Software [Discontinued]
*PLEASE READ* Notice of Discontinuation
Molecular Devices continually assesses partnerships and technologies to ensure alignment with our commitment to product quality, service, and customer satisfaction. As a result of Core Life Analytics’ (CLA) decision to cease operations, access to the StratoMineR platform cannot be guaranteed beyond Friday, February 7, 2025.
An intuitive and powerful platform for phenotypic profiling
Core Life Analytics StratoMineR™ software helps biologists analyze the complex data derived from high-content image analysis. A powerful, intuitive workflow allows users to port data analyzed in IN Carta® Image Analysis Software directly into StratoMineR where it is used to generate rich, interactive visualizations using advanced data mining methods.

Built for biologists
Intuitive analytics workflow. No coding required.

Phenotypic analysis
Use all of your high-content data to discover novel phenotypes.

Artificial Intelligence
Build your own AI models to discover the drugs of tomorrow
Features

Flexible data upload
Numerical data can be uploaded directly from IN Carta Image Analysis Software.

Artificial Intelligence
Machine learning models can be applied to leverage AI technology in data analytics.

Phenotypic characterization
Clustering and visualization of cellular phenotypes.

Quality Control
Use built-in data visualization tools for quick assessment of data quality and remove outliers.

Reduced data complexity
Data reduction decreases complexity and increases focus on key biological interactions.

Collaboration
Utilize project management tools for collaboration.
Import datasets from IN Carta for deeper insights into your data
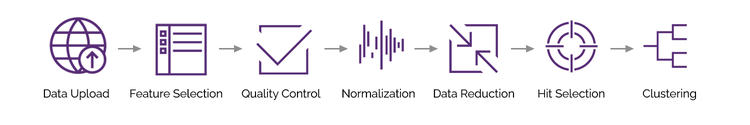
IN Carta Image Analysis Software provides robust, quantitative results from complex biological images and datasets utilizing advanced AI technology. Directly import this data into StratoMineR, an intuitive web-based platform which guides users through a typical workflow in analysis of high-content, multi-parametric data.
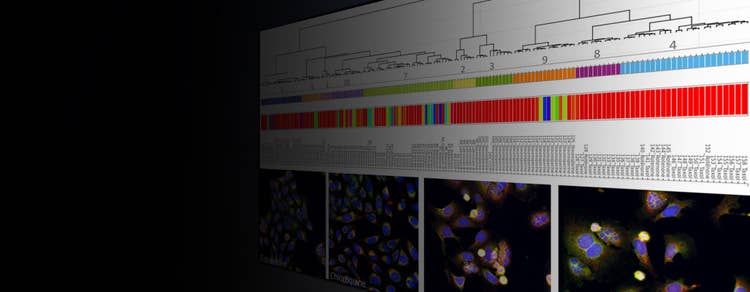
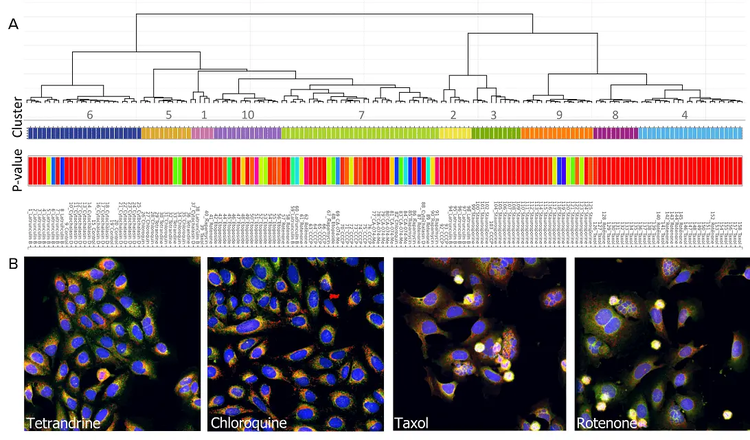
Cluster analysis

Cluster analysis: A) A dendrogram representing hierarchical relationships is shown. B) Examples of compound-treated cells belonging to the some of the clusters are shown. Cluster 5 consists of tetrandrine- and chloroquine-treated cells. Cluster 4 consists of rotenone- and paclitaxel-treated cells.
Scatter plot
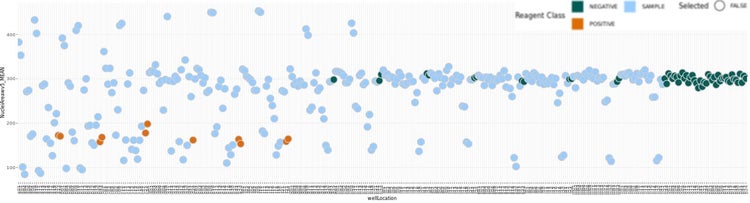
Example of a scatter plot using HC StratoMineR for visualization and exploration.