
Application Note
Sequence-Specific DNA Assay
Introduction
Measurement of specific DNA sequences can be achieved using the Threshold® System. Biotinylated and fluoresceinated oligonucleotide probes specific to the target sequence to be measured are used with the Immuno Ligand Assay (ILA) kit components. The probes are chosen so that they both anneal to the same strand of the target, adjacent to each other. DNA samples to be measured are digested with an appropriate restriction enzyme to liberate the target sequence on a small DNA fragment. The digested DNA is denatured in the presence of an excess of the biotinylated and fluoresceinated probes. The probes and denatured target are allowed to anneal, generating probe-target hybrids. These probe-target hybrids are captured on the biotinylated Threshold sticks using the ILA capture reagent (streptavidin) which binds to the biotinylated probe. The captured probe-target hybrids are then detected and quantitated using the ILA enzyme reagent (anti- fluorescein-urease conjugate) which binds to the fluoresceinated probe.
For sequence-specific assays two oligonucleotide probes are required, one biotinylated and the other fluoresceinated. They should be about 30 bases long and must both hybridize to the same strand of the target molecule. Larger DNA fragments containing the target site generally give lower signals, so for greatest sensitivity the sample or standard DNA should be digested with a restriction enzyme that yields a small fragment containing the binding sites for both probes. For this reason, the same restriction enzyme should be used for both standards and unknowns to achieve accurate quantitation.
This application note provides a preliminary protocol for such a specific sequence assay. The development and characterization of an assay for the Escherichia coli plasmid pGEM3 and related pMB1 based replicons (such as pBR322) is used as a model system. This application note is intended as a guide and does not represent a validation of this assay, nor necessarily the optimal performance parameters for all probe and target DNA combinations.
Materials
- Threshold® System from Molecular Devices Corporation (catalog #0200-0500), 1311 Orleans Drive, Sunnyvale, CA 94089, tel: 408-747-1700 or 800-635-5577.
- Immuno-Ligand Assay Detection Kit from Molecular Devices Corporation (catalog #R9003).
- Restriction enzyme HhaI from New England Biolabs (catalog #139S), used with the supplied 10X restriction buffer and 100X BSA.
- Biotinylated and Fluoresceinated oligonucleotide probes were purchased from Applied Biosystems. Probes were biotinylated or fluoresceinated at the 5' end by adding a biotin or fluorescein derivatized nucleotide in these positions during the synthesis. The probes used are complementary to a 114 bp conserved region of the origin of replication (ORI) region of the plasmid which is flanked by HhaI restriction sites. The probe sequences are (written 5' to 3'):
Biotinylated:
b-CCAGTTACCTTCGGAAAAAG
Fluoresceinated:
f-TAGCTCTTGATCCGGCAAACAAACCACCGCTGGTAGCGGT - Qiagen columns were purchased from Qiagen Inc. (Qiagen-tip 500, catalog #10063). Buffers for running the columns were made according to the Qiagen Plasmid Handbook.
- BSA, fraction V was purchased from Sigma Chemical Co. (catalog #A7888) and dissolved at 25 mg/mL in sterile water for injection.
- Hybridization Buffer. The formulation for Hybridization Buffer is:
Stir to dissolve in 900 mL of deionized water, then adjust to pH 7.4 with 10 M NaOH (approximately 10 mL) before making up to final volume. Filter sterilize through a 0.2 µm filter.
Methods
Standard molecular biology techniques can be used for generation of DNA stocks, restriction digestion and agarose gel electrophoresis. There are several comprehensive laboratory manuals covering these basic techniques1,2 including details of the reagents required. In general when handling DNA, aseptic technique and sterile disposables should be used.
Preparation of stock DNA
pGEM3 plasmid stock was prepared using Qiagen columns following the instructions in the Qiagen Plasmid Handbook. The concentration of this stock was determined by spectrophotometry, measuring the absorbance at 260 nm. The absorbance of 50 µg/mL of DNA at 260 nM is 1 O.D. The stock DNA was digested to completion with the restriction enzyme HhaI overnight at 37˚C. The efficiency of digestion was checked by agarose gel electrophoresis, and the digest purified by phenol extraction and ethanol precipitation.
The resulting nucleic acid pellet was resuspended in TE (10 mM Tris HCl, 1 mM EDTA pH 7.6) and the concentration determined by spectrophotometry. The digested DNA was then diluted to 100 ng/µL in hybridization buffer and stored at -20°C. This stock digested DNA was used for the generation of standard curves and for plasmid spikes in spike recovery experiments.
Assay protocol
All hybridizations were performed in Hybridization Buffer and detection was performed with the Threshold System and standard ILA reagents as follows:
Step 1 Dispense 100 µL of target DNA (Standards and digested samples +/- spike in Hybridization Buffer) to each 2 mL Sarstedt tube.
Step 2 Add 100 µL of probe mix to each tube (2.4 nM concentration of each probe in Hybridization Buffer). Vortex briefly to mix.
Step 3 Incubate tubes in a heating block at 105˚C for 10 minutes (denaturing step).
Step 4 Transfer all tubes to a heating block at 55˚C, incubate for 10 minutes (annealing step).
Step 5 Transfer all tubes to ice, incubate for 5 minutes.
Step 6 Add 1 mL of reconstituted ILA Capture reagent diluted 1:10 in ILA Assay Buffer. Cap the tubes and invert several times to mix in the Capture reagent.
Step 7 Transfer the entire volume of tubes to filtration units and filter all samples onto Threshold sticks on low vacuum.
Step 8 Add 2 mL of ILA Wash Buffer to each sample well, then filter on high vacuum.
Step 9 When all the Wash Buffer has filtered through, change to SPECIAL vacuum. It is important that all the wells are totally empty before adding the Enzyme reagent, otherwise the Enzyme will be diluted which will result in reduced signals for those wells.
Step 10 Add 100 µL of reconstituted ILA Enzyme reagent to each well. Check carefully for bubbles on the surface of the membrane. These will prevent the filtration of the enzyme. If a bubble is present it can be dislodged by sharply tapping the filter block with your hand.
Step 11 When the wells are empty, add 1 mL of ILA Wash Buffer to each sample well, then filter on high vacuum.
Step 12 When all the wells are empty turn off the vacuum and read the sticks.
Note: Reagent additions in steps 2, 6, 8, 10, and 11 can be made using an Eppendorf Repeater Pipettor with a Combitip®. The 100 µl additions are more precise if a micropipette tip is fitted onto the Combitip.
Preparation of standard curves
In order to quantitate specific sequences and compensate for stick to stick variation it is useful to generate a DNA standard curve and mid-calibrators to run in the # position on each stick. Standards were typically run as a twofold dilution series of the digested pGEM3 in hybridization buffer, in the range 15000 x 106 to 235 x 106 molecules/test (45 to 0.7 ng/test). A mid-calibrator of 1875 x 106 molecules/test and a zero calibrator of hybridization buffer was run on each stick in the # and * positions respectively. 100 µL of each of these standards and multiple aliquots of the zero and mid calibrators (one for each stick) were prepared and then treated with the samples according to the assay protocol. A typical standard curve is shown in Figure 1. The power equation was generally found to give the best fit for the pGEM3 standard curve.
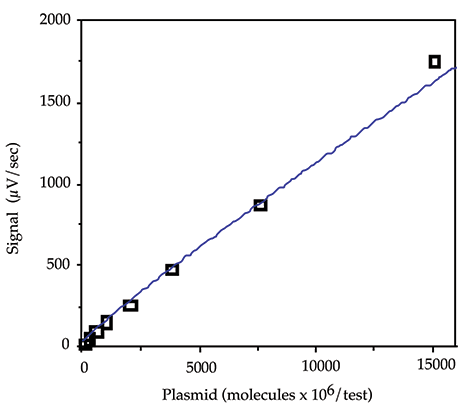
Figure 1: pGEM standard curve.
Assay characterization
Target fragment size effects
In the sequence-specific assay smaller target fragments give higher specific signals. To demonstrate this, samples of pGEM3 were digested with HhaI, HinfI, and HindIII, which release the target region on fragments of 114, 509, and 2867 bp respectively. Twenty nanograms of each digested DNA was assayed following the routine protocol and the raw signals were compared. The implication is that, to maximize signal, target sites should be chosen such that they can be liberated on the smallest fragment possible. The results are shown in Table 1.
Table 1: Effect of target size on signal.
Probe loading study
A probe loading study was performed to determine the appropriate concentration of probes to use in the assay. Probe mixes containing 1.2, 2.4, 6.0, and 12.0 nM of each probe were tested with 0, 236 x 106 , and 15000 x 106 molecules/test of pGEM3. The resulting data is shown in Figure 2. The probe mix with a concentration of 2.4 nM of each probe was chosen because it gave a combination of low background, high signal and economy of use of the probes.
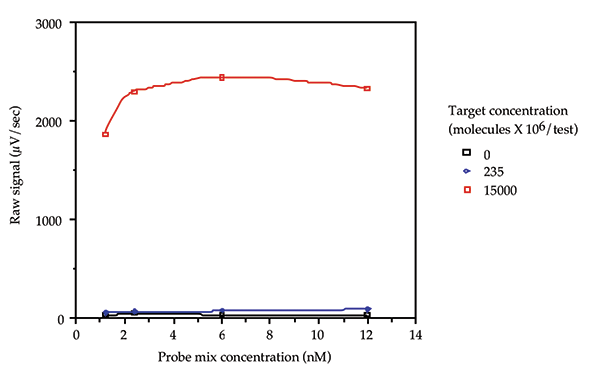
Figure 2: Probe loading study.
Denaturation kinetics
The time required for denaturation of the double stranded target DNA was determined using a high level of target DNA (15,000 x 106 molecules/test) and denaturing times of 0, 1, 2.5, 5, 10, 15, 30, and 60 minutes. A greatly reduced signal was seen at 0 and 1 minute of boiling. Denaturation times greater than 1 minute gave much higher signals. 10 minutes was selected as the denaturing time for the routine protocol.
Hybridization kinetics
The time required for hybridization (annealing) of the oligonucleotide probes to the single stranded target DNA was determined using 0, 235 x 106 and 30,000 x 106 molecules/test of target DNA, and annealing times of 0, 5, 10, 15, and 30 minutes. The data is shown in Figure 3. Ten minutes was selected as the optimum hybridization time for the routine protocol.
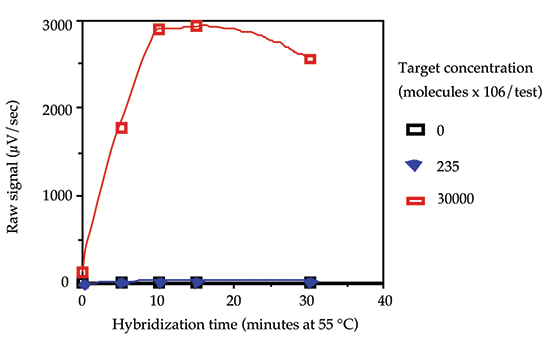
Figure 3: Hybridization kinetics.
Limit of detection
The limit of detection of the pGEM3 probe assay was determined following the guidelines in the ILA section of the Threshold System Operator's Manual. The pGEM3 assay has a limit of detection of 235 x 106 molecules/test with a four standard deviation separation from the background signal.
Reproducibility
Intra-assay reproducibility was assessed by testing 6 replicates of a pGEM3 HhaI digest at approximately 1875 x 106 molecules/test. The results are shown in Table 2:
Table 2: Within assay reproducibility.
Inter-assay (day-to-day) reproducibility was assessed in three different ways by running six independent assays. First, a sample of bulk HhaI digested pGEM3 stock was diluted to approximately 1875 x 106 molecules/test, aliquoted and tested in triplicate in each assay. Second, a sample of intact pGEM3 was digested with HhaI on six occasions, diluted down and measured in each independent assay. Third, a sample of E. coli DH5α (pGEM3) total DNA with and without an intact pGEM3 spike (of approximately 1500 x 106 molecules per test) was digested with HhaI on six occasions, diluted down and measured in each independent assay. In this way the day to day assay variability could be assessed with and without the added variability of day to day digestion. The quantitation results are shown in Table 3. The spike recovery in the E. coli DNA digests varied from 98 to 128%.
Table 3: Day-to-day reproducibility (quantitation x 106 molecules/test)
Specificity
In order to test the pGEM3 assay specificity, three levels of pGEM3 (0, 235 x 106 and 15000 x 106 molecules/test) were assayed following the standard protocol in the presence of 0, 0.1 µg/test and 1 µg/test of digested calf thymus DNA (a mixture of calf thymus DNA digested with HaeIII and calf thymus DNA digested with RsaI). Even at 1 µg/test of calf thymus DNA with a 235 x 106 molecules/test pGEM3 sample (690 pg/test), a 1500 fold excess by mass of calf thymus DNA, no significant increase was seen in the signal. There was no significant decrease in signal from the high level of pGEM3 (15000 x 106 molecules/test) in the presence of 1 µg/test of calf thymus DNA, implying that the calf thymus DNA does not bind either probe. The results are shown in Table 4:
Table 4: Effect of non-target DNA (signals in µV/sec)
Summary
The data presented in this application note was generated using a pGEM3 model system digested with HhaI, and a sequential ILA protocol. Good linearity was seen with standard DNA preparations, and the reproducibility of the assay was excellent. The sequence-specific assay has been used to quantitate PCR products (3,4) and should be useful fora variety of other applications such as plasmid copy number determination.
References
- Ausubel, F.M., Brent, R., Kingston, R.E., Moore, D.D., Seidman, J.G., Smith, J.A., and Struhl, K. Current Protocols in Molecular Biology, Volumes 1 to 3, WileyInterscience (1989).
- Sambrook, J., Fritsch, E.F., Maniatis, T. Molecular Cloning, A Laboratory Manual, 2nd Edition, Volumes 1 to 3, Cold Spring Harbor (1989).
- Olson, J.D., Panfili, P.R., Zuk, R.F., and Sheldon, E.L. Quantitation of DNA hybridization in a silicon sensor-based system: application to PCR. Molecular and Cellular Probes, 5:351-358 (1991).
- Reif, T.C., Johns, M., Pillai, S.D., and Carl, M. Identification of capsule-forming Bacillus anthracis spores with the PCR and a novel dual-probe hybridization format. Applied and Environmental Microbiology, 60:1622-1625 (1994).