
Application Note
Quantitative single-molecule spatial transcriptomics using the ImageXpress HCS.ai High Content Screening System
- Gain deeper biological insights by directly linking high-resolution morphological phenotypes with precise transcriptomic expression profiles
- Achieve reliable single-molecule RNA quantification through high-sensitivity optics and advanced AI- driven segmentation algorithms that minimize false positives and negatives
- Optimize assay performance for single-RNA resolution and maximize well coverage by combining 20X water immersion objectives with a 1.5X magnification changer, ensuring both detail and efficiency in acquisition
- Enhance data completeness and reproducibility with automated site tiling and seamless image stitching, enabling full-well analysis without loss of transcript counts at field-of-view boundaries
Zhisong Tong | Applications Scientist | Molecular Devices
Introduction
Spatial transcriptomics is needed to understand how genes are expressed within their specific locations, providing insights into cellular organization, interactions, and function that are lost in traditional bulk or single-cell RNA sequencing. This spatial context is crucial for analyzing ex vivo tissue organization but is becoming increasingly important for in vitro screening assays as scientists build complex multicellular models. Spatial transcriptomics has applications in various diseases, including cancer, neurological disorders, cardiovascular diseases, and infectious diseases. By studying the spatial context of gene expression in diseased tissues, researchers can identify potential therapeutic targets and understand how diseases develop and progress. In addition, spatial techniques can also be used to enable pooled screening approaches, where multiple genetic or chemical perturbations are tested simultaneously in a single population of cells. The recent advancement of optical pooled screening (OPS) can be used to link spatial information from pooled genomic modifications with image based phenotyping1. In essence, spatial transcriptomics bridges the gap between molecular biology and tissue architecture, providing a powerful tool for understanding the complex interplay of genes, cells, and their environment in both healthy and diseased tissues.
Popular imaging-based methods to study spatial transcriptomics include using targeted probes for Fluorescence In Situ Hybridization (FISH) and direct reading of nucleotide sequences using In Situ Sequencing (ISS). These spatial techniques face challenges in accurate transcript assignment to cells, signal intensity limitations, robust autofocus and increasing throughput. Accurate cell segmentation is crucial for assigning transcripts to their correct cellular origin. Existing cell segmentation methods can be inaccurate, leading to over-or-under segmentation, misassigning transcripts, and requiring manual intervention. Imaging methods face challenges in improving signal intensity and thus the detectable sensitivity of the imaging system.
In this study, we used the next-generation ImageXpress® HCS.ai High-Content Screening System and AI-enabled IN Carta® Image Analysis Software to address challenges in image-based spatial transcriptomics. We demonstrate a transcriptomic assay with single molecule detection of both housekeeping gene succinate dehydrogenase flavoprotein subunit A (SDHA) and cytokine Interleukin-6 (IL-6). We demonstrate a 6 fold upregulation of IL-6 in response to Tumor Necrosis Factor alpha (TNF-α) and pro-inflammatory cytokine Interleukin-1 beta (IL-1β). This is combined with immunohistochemical detection of filamentous action to provide cellular context.
The ImageXpress HCS.ai System, paired with IN Carta Image Analysis Software, provides an integrated solution for single-molecule detection through precise cell segmentation and improved low-signal sensitivity—enabling accurate transcript identification and assignment at the cellular level. This study demonstrates proof of concept for combining spatial transcriptomic data with morphological image analysis, offering a powerful approach for advancing complex biological research.
Methods
Cell culture
Hela cells were seeded into a 384 well plate (Corning Life Sciences) using DMEM (Dulbecco’s Modified Eagle’s Medium, Sigma) supplemented with 10% FBS (Sigma) and 1% Pen/Strep (Penicillin/Streptomycin, Sigma) two days before the assay day, at a density of 1000 cells per well. The cells were cultured in an incubator with 5% CO2 at 37 °C for 24 hours and then induced by 10ng/mL TNF-α and 10ng/mL IL-1β for 16 hours in the incubator, before proceeding to the RNA hybridization.
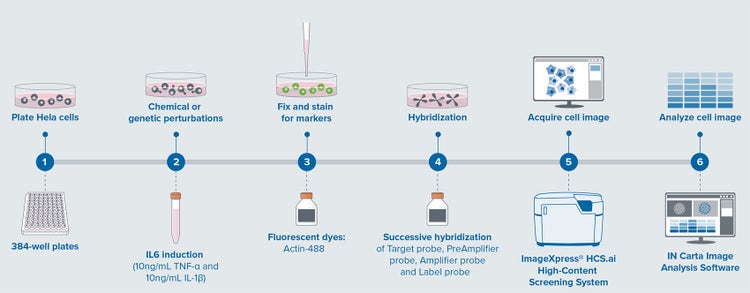
Figure 1. Workflow of RNA FISH assay.
RNA hybridization
On assay day, the RNA FISH was performed based on the protocols on ViewRNA™ Cell Plus Assay kit (Thermo Fisher Scientific). Briefly, the cells were fixed and permeabilized with Fixation/Permeabilization Solution for 30 minutes at room temperature, followed by washing three times in PBS with RNase Inhibitor. The cells were then blocked with Blocking/Antibody Diluent Solution for 20 minutes at room temperature, followed by incubating in Phalloidin- Alexa Fluor 488 (Thermo Fisher Scientific) for 1 hour in room temperature. After gently washing the cells three times in PBS with RNase Inhibitor, the cells were overlayed in Fixation Solution for 1 hour at room temperature. Cells were then washed three times in PBS with RNase Inhibitor, followed by hybridizing the Target Probe (Table 1) diluted in Probe Set Diluent for 2 hours at 40 °C. After Target Probe hybridization, the cells were washed five times in Wash Buffer. We then hybridized cells with PreAmplifier Mix diluted in Amplifier Diluent, Amplifier Mix diluted in Amplifier Diluent and Label Probe Mix (Table 1) diluted in Label Probe Diluent for one hour at 40 °C followed by washing five times with Wash Buffer, respectively and successively. The set of probes were designed such that SDHA are labeled with Alexa Fluor 647 and IL6 are labeled with Alexa Fluor 546. Last, the cells were stained with DAPI for 5 minutes at room temperature. The above reagents are all from ViewRNA Cell Plus Assay kit except the Phalloidin-Alexa Fluor 488. All reagents and dyes are diluted according to the manufacturer’s recommendations.
Image acquisition
Images were captured using the ImageXpress HCS.ai Advanced High-Content Screening System at 20X objective magnification with a 1.5X magnification changer (total 30X) and a Standard Spinning Disk Confocal Option (60 µm pinhole). Four fluorescent channels—Cy5, TRITC, FITC, and DAPI—were acquired. Z-stacks spanning 15 µm with 1 µm intervals were collected, and 2D maximum projections for each channel were saved. To maximize well coverage, 36 non-overlapping sites per well were acquired, tiled into a montage during acquisition, and used directly for analysis.
Image analysis
Montaged well images were analyzed in IN Carta Image Analysis Software to perform per-cell quantification of RNA dots. A built-in AI model was applied to the DAPI channel for nuclei segmentation, with the resulting objects designated as Nuclei. Then a built-in Cells/Robust algorithm was used to segment cells in Cy5 channel with reference to nuclei mask generated above and named as Cells. Following above, a built-in Organelles/Robust Puncta algorithm was used to segment SDHA and IL6 in Cy5 and TRITC channels, respectively and named as RNA1 and RNA2, respectively. We also set Cells as Parent and RNA1 and RNA2 as Child to build target linking between the cells and the RNA within. The results were then exported and plotted.
Results
High detection sensitivity and automatic montage of ImageXpress HCS.ai ensures complete count
A low signal-to-noise ratio (SNR) remains a major challenge in spatial transcriptomics, particularly when detecting low-abundance transcripts. While the branched DNA technology in the current ViewRNA Cell Plus Assay provides one method for signal amplification, enhancing the detection sensitivity of the imaging system is equally critical. The optical light path in the ImageXpress HCS.ai System has been engineered to optimize SNR, delivering more than double the SNR compared to the previous- generation imager and enabling the detection of dim or low-intensity objects².
Low signals and stringent resolution requirements often necessitate the use of high-magnification imaging systems, which can limit the imaging area per field of view (FOV). To compensate, additional sites per well may be acquired; however, this introduces another challenge— cells can appear in adjacent sites, leading to incomplete RNA transcript counts. The MetaXpress® Acquire High-Content Image Acquisition Software (MXA) addresses this issue with an automated site montage tool, which tiles or stitches all sites from the same well during acquisition (Figure 2A). Users can choose to maximize well coverage with a tiled configuration (no image overlap) or specify a percentage overlap for seamless merging of adjacent FOVs. Figure 2B illustrates a montage of 36 tiled sites within the same well.
Table 1. List of probe types associated with each channel.
The system also allows acquisition using a final magnification of 30X by combining 20X Water Immersion objective lens with 1.5X magnification changer. This configuration allows optimized acquisition settings to balance image resolution and efficient well coverage of 82%. Moreover, the wide spectrum selection of the system from DAPI to Cy7 makes multiplexing detection possible at the same time.
Parent-child target linking and positional output of IN Carta Image Analysis Software ensures direct spatial profiling
Spatial transcriptomics requires accurate segmentation of cells (Figure 4C), transcript assignment to cells and spatial information of cells. For customized workflow, the assignment of transcript to cells may need a lot of extra work and can be time-consuming. The parent-child linking feature in IN Carta software (Figure 3A) enables per-object counts without the need for additional identification of the cells associated with RNA transcripts, in this case, the SDHA (RNA1) Count and IL-6 (RNA2) Count (Figure 3B).
Additionally, IN Carta software also outputs the Center of Gravity X and Center of Gravity Y of cells, preserving the spatial information of the transcripts (Figure 3B).
TNF-α and IL-1β stimulated Hela cells shows 6-fold increase in IL6 expression
Hela cells, a cell line derived from a cervical cancer tumor, were used to demonstrate the capability of ImageXpress HCS.ai system in single molecule detection. One housekeeping gene SDHA was chosen for its expression level detection since it is essential for basic cellular functions and expressed in all cells under normal conditions. The other gene that encodes IL-6 is a cytokine primarily involved in inflammation and immune responses, and its expression is highly regulated and can vary significantly depending on the cellular context and external stimuli. We used 10ng/mL TNF-α and 10ng/mL IL- 1β to stimulate the expression of IL-6, as a comparison to normal Hela cells without any stimulation.
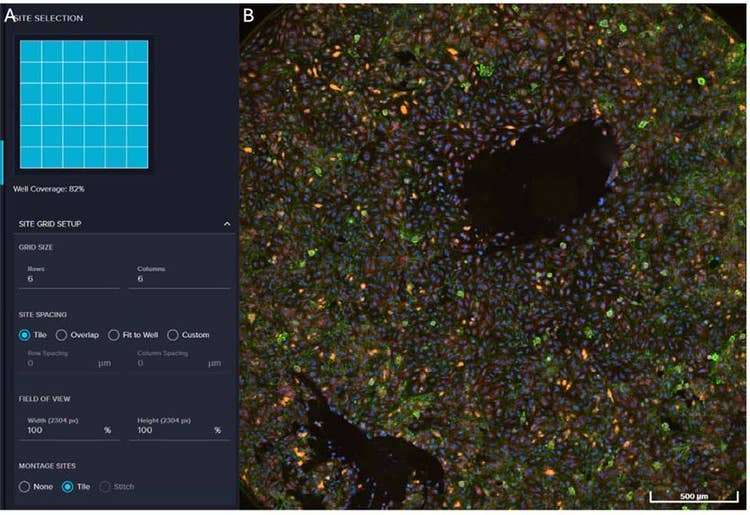
Figure 2. A. Screenshot of SITE SELECTION in MetaXpress Acquire software; B. A montage image of 36 sites from the same well of an overlay of DAPI, Actin (Green), IL6 (Orange) and SDHA (Red).
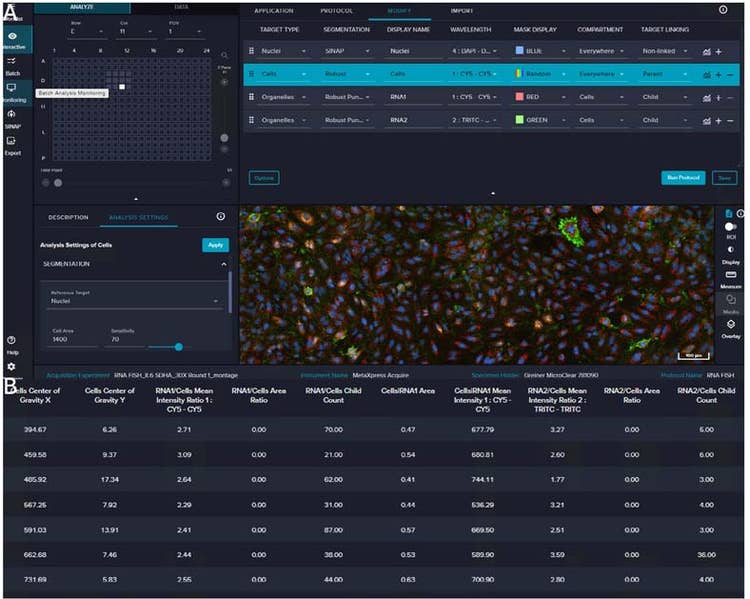
Figure 3. A. Screenshot of the protocol setup in IN Carta software; B. Screenshot of the output features.
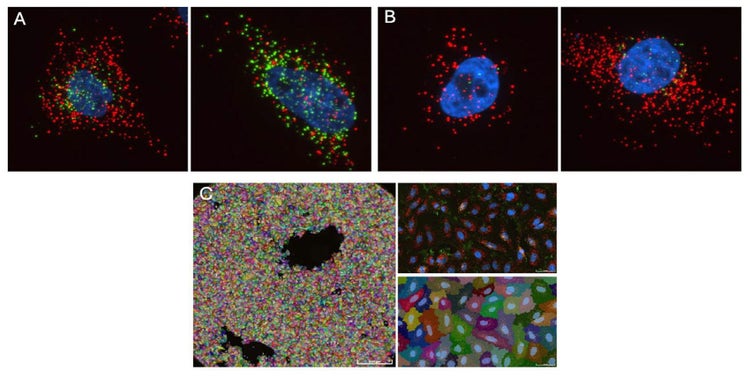
Figure 4. A. Representative images of fluorescently hybridized SDHA (Red) and IL-6 (Green) with IL-6 stimulation; B. Representative images of fluorescently hybridized SDHA (Red) and IL-6 (Green) without IL-6 stimulation; C. The cell segmentations with random color of the whole well with zoom-in region.
Hela cells, unlike normal human cells, exhibit significant variability in housekeeping gene expression levels due to their highly abnormal and unstable genome3. This genomic instability, characterized by structural variations and copy number alterations, leads to diverse expression patterns for genes, including those traditionally considered housekeeping genes. This fact is consistent with our observation of SDHA expression in Hela cells (Figure 4A, 4B, red dots), where the average levels remain similar regardless of IL-6 stimulation across different wells, although there is considerable standard deviation (Figure 5A, 5B).
IL-6 expression also varies across different cells but shows a significant upregulation upon stimulation (Figure 4A, 4B, green dots and 5A, 5B). On average, IL-6 expression is over 6-fold increase in IL-6 stimulation wells compared to wells without stimulation. This observation is shown in the 2D expression map where IL-6 stimulated cells represent a wide-angle cone shape, while the non-stimulated cells only cover a narrow-angle shape near to the x-axis (Figure 5C).
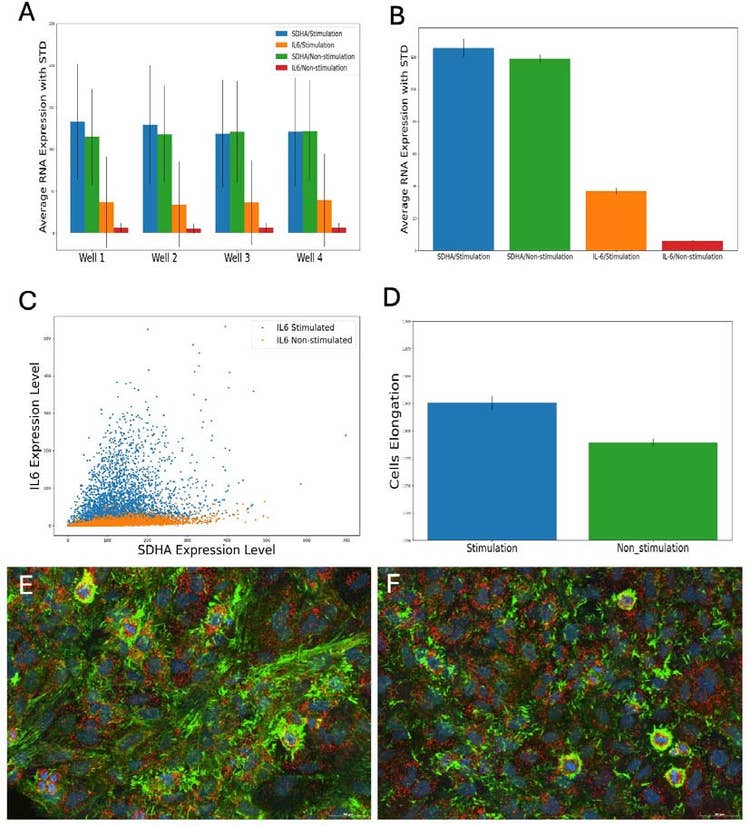
Figure 5. A. Bar graph of average per cell RNA expression, with STDEV representing variability of RNA expression across cell population; B. Bar graph of averaged RNA expression per well with standard deviation representing variability of RNA expression across wells; C. 2D expression map of SDHA and IL-6; D. Bar graph of averaged cell elongation (ratio of first to second principal lengths) per well with standard deviation representation variability across wells; E. Overlay image of Actin (Green), SDHA (Red) and DAPI (Blue) with stimulation; F. Overlay image of Actin (Green), SDHA (Red) and DAPI (Blue) without stimulation.
To link the morphological data with the transcriptomics data, we measured the cell elongation from the cell segmentation masks and found that the average cell elongation from wells with stimulation is 2% larger than that of non-stimulated cells (Figure 5D)4. The student’s t-test shows p-value=0.00014 (<0.05), indicating a statistically significant difference between the elongation averages. The observed changes in cell morphology, such as elongation, often involve rearrangement of the cell’s cytoskeleton, particularly the actin networks. Indeed, the stimulated Hela cells exhibit longer actin fibers (Figure 5E, 5F).
Spatial distribution maps show distinct expression profiling between SDHA and IL-6
Since SDHA is considered housekeeping gene and IL-6 is not, we expect the spatial distribution maps between the two would be significantly different. With the spatial information exported from IN Carta software, we plotted the 2D spatial distribution maps of SDHA and IL-6, respectively (Figure 6). We divided the expression numbers into three expression levels, i.e., a low expression level with a number less than 30, a middle expression level with a number greater than 30 but less than 100, and a high expression level with a number greater than 100. We found that the spatial distributions of both genes’ expression are random. While SDHA are mainly categorized in the groups of middle and high expression levels, IL6 are mostly categorized in the groups of middle and low expression levels.
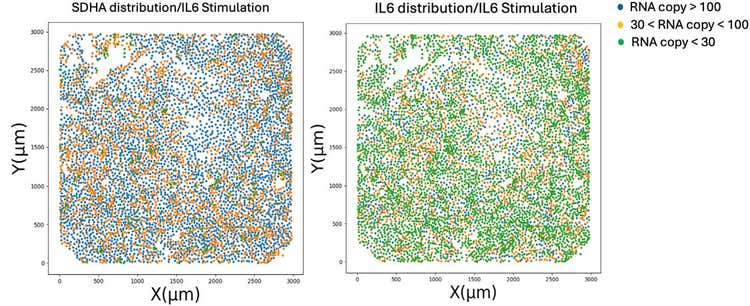
Figure 6. A. Spatial distribution of categorized SDHA expression levels with IL-6 stimulation; B. Spatial distribution of categorized IL-6 expression levels. Please note that each dot represents a cell.
Conclusion
This application note presents a spatial transcriptomics study conducted using the ImageXpress HCS.ai System. The system’s high detection sensitivity and automated tiling capabilities enable precise detection of both bright and dim signals – essential for reliable single-molecule analysis. A final magnification of 30X was selected to achieve an optimal balance between image resolution and well coverage, ensuring accurate single-molecule quantification.
We applied a deep learning model to segment nuclei and leveraged the built-in cell segmentation algorithms in IN Carta Software to ensure comprehensive RNA transcript counts. Results revealed a more than six-fold increase in IL-6 expression in IL-6–stimulated HeLa cells compared to unstimulated controls. By combining the software’s target linking feature with per-cell spatial information, we successfully mapped the spatial distribution of each RNA species.
References
- Feldman et al., Optical Pooled Screens in Human Cells, 2019, Cell 179, 787–799.
- Application Note, Zhisong Tong and Angeline Lim, Screening of 3D spheroids using a robust, sensitive, next-generation high content imager.
- Melincovici, Carmen Stanca et al. “Vascular endothelial growth factor (VEGF) – key factor in normal and pathological angiogenesis.”
Romanian journal of morphology and embryology = Revue roumaine de morphologie et embryologie vol. 59,2 (2018): 455–467. - A. Frattini et. al, High variability of genomic instability and gene expression profiling in different HeLa clones, 2015, Scientific Reports 5:15377
- Jin-Wei Miao et al., Interleukin-6-induced epithelial-mesenchymal transition through signal transducer and activator of transcription 3 in human cervical carcinoma, 2014, International Journal of Oncology 45, 165–179.