
Application Note
Quantitate GPCR activation using automated cell imaging and analysis
- Screen for ligands to known and orphan GPCRs
- Apply a predefined image analysis module for quantifying subcellular objects
- Enable rapid results with simultaneous image acquisition and analysis
Matthew Hammer | Applications Scientist | Molecular Devices
Introduction
GPCRs are the largest group of signal transducing transmembrane proteins, constituting roughly 4% of the proteincoding genome. They play integral roles in a wide range of biological pathways from response to sensory inputs (gustatory, olfactory, and visual) to cell growth, and cardiovascular and immune system regulation. They have also been implicated in a wide variety of diseases, such as autoimmune diseases, cancer, as well as metabolic, cardiovascular, and neurologic disorders. With their ability to demonstrate high specificity and affinity for their ligand, GPCRs are a crucial target for drug discovery. Furthermore, there are still many GPCRs considered orphan receptors, which are GPCRs whose interacting ligand has not yet been discovered.
Automated imaging and analysis is a valuable tool for GPCR research and screening. The acquisition and analysis of high resolution cellular and subcellular images by the ImageXpress® Nano (IXN) Automated Imaging System and CellReporterXpress (CRX) Automated Image Acquisition and Analysis Software expands the field of assays that can be performed, including quantitation of granularity, protein aggregation, and GPCR activation. Typically, GPCR screens have centered around receptor binding, guanine nucleotide binding, and second messenger assays1 , which require knowledge of the GPCR’s interacting G-protein (Gs, Gi/o, Gq, G12, or Gtransducin). The Transfluor assay is a G-protein independent assay, which utilizes the common pathway of desensitization (Figure 1) to screen known and orphan GPCRs, their function, and ligands. The assay utilizes cell lines after they have been genetically engineered to overexpress the gene for the GPCR of interest and to express a fluorescently tagged ß-arrestin.
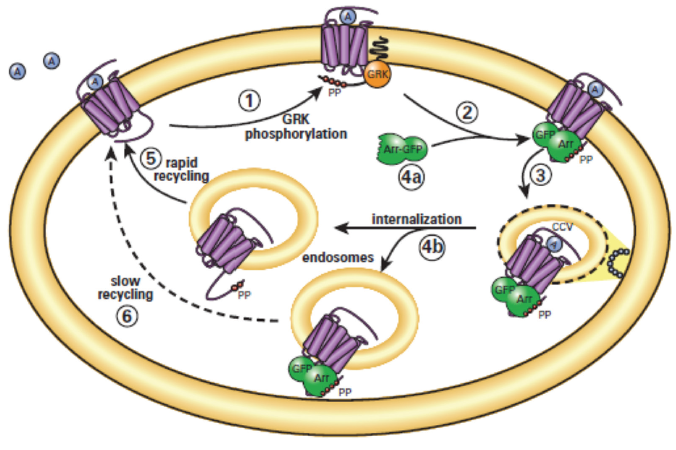
Figure 1. Transfluor assay technology. Role of arrestins in model of GPCR desensitization and resensitization. (1) Agonist-activated GPCRs are phosphorylated by GRKs (G-protein coupled receptor kinases) on their carboxyl-terminal tails. (2) Arrestins (Arr) translocate to and bind the agonist-occupied, GRK-phosphorylated receptors at the plasma membrane. (3) Arrestins target the desensitized receptors to clathrin-coated pits for endocytosis. (4a) Some receptors bind arrestin with low affinity and dissociate from arrestin at or near the plasma membrane. (5) These receptors internalize without arrestin into endocytic vesicles and recycle rapidly. (4b) Other receptors bind arrestin with high affinity and remain associated with arrestin such that the receptor-arrestin complex internalizes as a unit into endocytic vesicles. (6) These receptors recycle slowly.
In our experiment, enhanced and wild-type (wt) ß-2-adrenergic receptor (ß2AR) and ß-arrestin2-GFP (ßarr2-GFP) expressing U20S cells were used as the model system. The wt-ß2AR were used to visualize the small, fluorescent pits. In the enhanced cell line, the ß2AR-ßarr2-GFP complex persists as the receptor invaginates from the plasma membrane into larger clathrincoated vesicles (Figure 2). Both cell types were treated with isoproterenol, a beta-sympathomimetic that is selective to ß2AR.
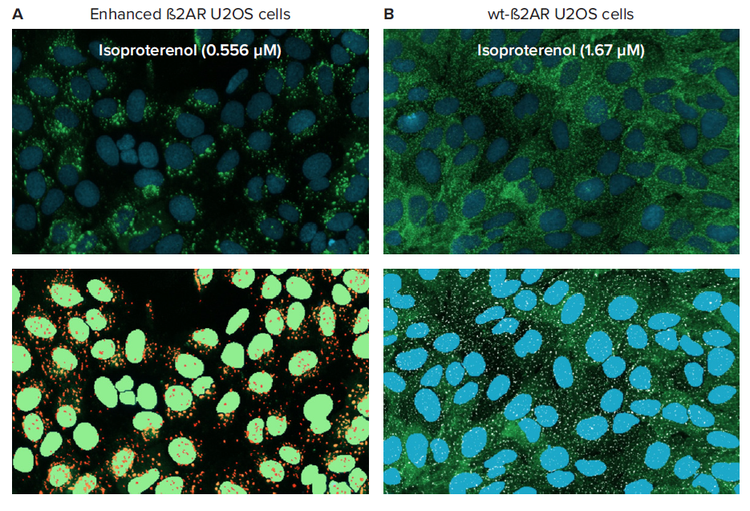
Figure 2. Transfluor assay cellular phenotypes as a result of isoproterenol treatment. ß-arrestin-GFP expressing ß2AR-U2OS cells treated with isoproterenol were imaged at 20X with the ImageXpress Nano system. Zoomed images of cells and software segmentation overlays are shown here: (A) Enhanced ß2AR vesicle forming (nuclei masks in green, vesicle masks in orange) and (B) ß2AR-wt pit forming (nuclei masks in blue, pit masks in white) U20S cells.
Materials
- Transfluor Assay Kit (Molecular Devices); Transfluor® Evaluation kits R8177 or R8178 (Molecular Devices)
- ß-arrestin 2-GFP (ßarr2-GFP) ß-2-adrenergic receptor (ß2AR)-expressing U2OS cells (Molecular Devices)
- U2OS culture media: MEM (Gibco Cat.#11095) with 10% heatinactivated FBS (Gibco Cat. #10082), 10 µg/mL gentamicin (Gibco Cat. #15710), 10 mM HEPES (Gibco Cat. #11344), 0.4 mg/mL Zeocin (Gibco Cat. #R250), and 0.4 mg/mL G418 (Gibco Cat. #10131)
- Assay Dilution Buffer (Starvation media): Serum-, phenol red-, and antibioticfree MEM (Gibco Cat. #51200) with 10 mM HEPES
- Assay Dilution Buffer with Ascorbic acid: 1 mg/mL solution of ascorbic acid (sodium L-ascorbate, Sigma Cat. #A7631) in Starvation media
- Isoproterenol stock solution: 5 mM stock solution of (-)-isoproterenol (+)-bitartrate salt (Sigma Cat. #I2760) in cell-culture grade DMSO (Sigma Cat. #D2650)
- Hoechst 33342, 10 mg/mL (Invitrogen Cat. #H3570)
- DPBS, calcium chloride- and magnesium chloride-free, (Sigma Cat. #D8537)
- 4% methanol-free formaldehyde: 16% methanol-free formaldehyde (Polysciences Cat. #18814-20) diluted in DPBS with calcium chloride and magnesium chloride (Gibco Cat. #14040)
- ImageXpress Nano Automated Imaging System with CellReporterXpress Automated Image Acquisition and Analysis Software (Molecular Devices)
Methods
Enhanced ß2AR and wild-type ß2AR U2OS cells were plated at 7,000 cells per well in 50 µL of U2OS media in a 384-well, clear bottom microplate. The cells were incubated at 37°C, 5% CO2 overnight to allow the cells to grow and to attach to the bottom of the wells. After 24 hours of incubation, the media was replaced with Assay Dilution Buffer (ADB; MEM media + 10 mM HEPES) for a 45-60 minute serum starvation at 37°C, 5% CO2. As the cells were being serum starved, 2X isoproterenol solutions were prepared in ADB (MEM media + 10 mM HEPES containing ascorbic acid at 1 mg/mL). Post-serum starvation, the cells were subsequently treated with the 1:3 dilution series of isoproterenol for final 1X concentrations of 5 µM down to 6.27 pM. The cells were then placed in an incubator for 30 minutes at 37°C, 5% CO2. 10 µL of a 1 µL/mL Hoechst 33342 solution was added to the cells, which were then placed back into the incubator for an additional 30 minutes. The isoproterenol treatment lasted for 60 minutes.
Then, the media was aspirated from each well, and the cells were fixed with 50 µL of a 4% formaldehyde solution. The plate remained in the fixing solution for 30 minutes in the dark at room temperature.
Post-fixing, the cells were washed twice with 50 µL of PBS and stored in 50 µL of PBS containing 10 mM ascorbic acid. Plates were imaged using the ImageXpress Nano system with CellReporterXpress software. The Vesicles and Pits analysis module was used to quantify subcellular vesicles and pits during image acquisition.
Combined image acquisition and analysis enables rapid production of assay results
The entire microplate was imaged using a 20X Plan Fluor objective to visualize fluorescent subcellular granules (Figure 2). Vesicles were distinguished from pits based on their larger size and brighter fluorescent intensity. Enhanced vesicle forming ß2AR U2OS cells were imaged with one site, as one field of view captured up to 600 cells and produced statistically relevant results for vesicle counts. Wild-type pit forming ß2AR U2OS cells were imaged with four sites to enhance statistical accuracy of pit measurements by capturing up to 2,600 cells in the four fields of view. The cells were imaged with two channels, DAPI for the Hoechst stained nuclei and FITC for the GFP-expressing ß2AR-ßarr2-GFP vesicles and pits. The preset plate definitions and automatic laser and image-based autofocus aided in finding high quality image focus rapidly with minimal adjustment to focus offsets for the two channels. Reasonable exposure times (200 ms for FITC, 40 ms for DAPI) resulted in rapid image acquisition.
The size and intensity parameters used for separately identifying the pits and vesicles was interactively determined within the predefined Analysis Module “Pits and Vesicles.” User-selectable quantitative outputs, reported on a per cell or per image basis, such as total and average vesicle and pit counts, total vesicle and pit area, and average intensity and integrated intensity for GFP ensured a thorough evaluation of isoproterenol effects on the cells. Users can analyze images on the fly during acquisition or acquire and save plates of images for later evaluation.
Generate dose response curves for compound treated cells
Both the enhanced and wt-ß2AR U2OS cells were treated with isoproterenol, an analog of epinephrine that has betaadrenergic receptor agonist activity, to demonstrate the efficacy of the Transfluor assay in monitoring the ligand activation of GPCRs. A definite dose-response was noticed in both cell types as the formation of vesicles and pits increased as the concentration of isoproterenol increased, measured by the average number of pits and vesicles formed per cell (Figure 3 and 4). The EC50 values for isoproterenol treatment, calculated from a 4-parameter log curve fit of the dose-response curve, were 0.002 µM for enhanced ß2AR U2OS cells and 0.012 µM in wt-ß2AR U2OS cells.
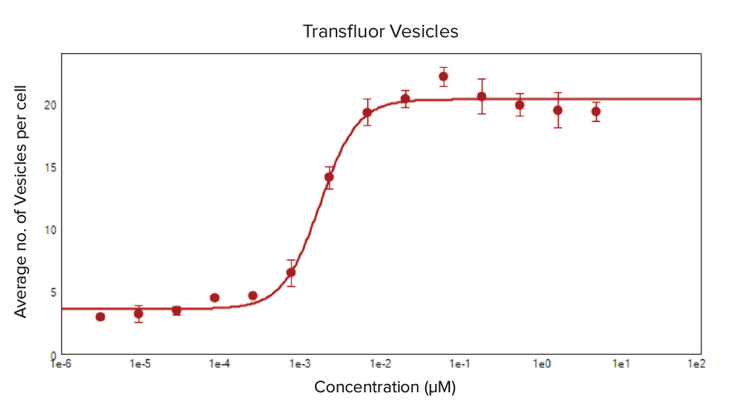
Figure 3. Dose-response curve for the average number of vesicles formed per cell due to isoproterenol treatment. Enhanced ß2AR U2OS cells formed ß-arrestin-GFP endocytotic vesicles upon treatment with 1:3 serial dilutions of isoproterenol (5 μM–6.27 pM). A Pits and Vesicles analysis in the CellReporterXpress software analyzed the dose-dependent formation of vesicles. A 4-parameter curve fit for the average number of vesicles per cell was plotted against the concentration of isoproterenol and produced an EC50 value of 0.002 μM.
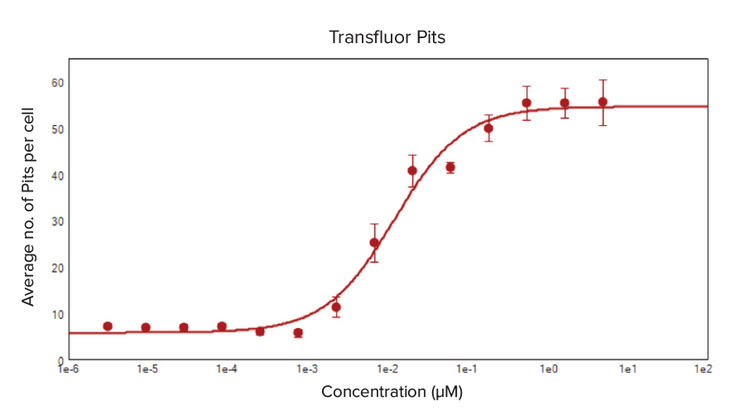
Figure 4. Dose-response curve for the formation of pits in ß2AR-wt U2OS cells treated with isoproterenol. Wild-type ß2AR expressing U2OS cells were treated in quadruplicate with isoproterenol, and they expressed green fluorescing ß2AR-ßarr-2-GFP pits. The predefined Pits and Vesicles analysis module in CellReporterXpress was optimized to locate and count pits. The average number of pits per cell were calculated by the software analysis algorithm, and the data from quadruplicate wells for each specific isoproterenol concentration treatment was averaged to create a 4-parameter curve fit dose-response curve. The EC50 value for isoproterenol was 0.012 μM.
Conclusion
The ImageXpress Nano automated imaging system and CellReporterXpress software successfully evaluated the impact of ß2AR ligand on morphological and phenotypic changes in the transfluor U2OS cells. The combination of high resolution image acquisition with synchronous multi-parameter image analysis efficiently and accurately analyzed the results of the Transfluor assay. The predefined Pits and Vesicles analysis module of CellReporterXpress software clearly identified and quantified the pits and vesicles formed by ß-arrestin-GFP translocation to activated ß2AR GPCRs. By generating highly informative and biologically relevant phenotypic data, the automated imaging system and software enables discovery of ligand-GPCR relationships.
References
- Doucette, Christopher, Kevin Vedvik, Elizabeth Koepnick, Aaron Bergsma, Brian Thomson, and Tammy C. Turek-Etienne. “Kappa Opioid Receptor Screen with the Tango™ ß-Arrestin Recruitment Technology and Characterization of Hits with SecondMessenger Assays.” Journal of Biomolecular Screening 14.4 (2009): 381-94. Web.
- Fennell, Myles. Transfluor Assay Development. 16 Sept. 2006. FLIPR Users Meeting. https://support.moleculardevices.com/s/. com/pdfs/Fennell_Wyeth.pdf