
Application Note
Monitor cell proliferation and cell cycle in real time
- Perform live cell experiments with environmental control and time-lapse imaging
- Monitor cell division and evaluation of compound effects in real time
- Easily export time-lapse data into MP4 format and save as a video
Introduction
Oksana Sirenko, PhD | Sr. Research Scientist | Molecular Devices
Felix Spira, PhD | Applications Scientist | Molecular Devices
András Málnási-Csizmadia, PhD | Professor | Eötvös Loránd University, Hungary
There is an increased need to expand the variety and complexity of cell-based assays for biological research and drug discovery. Live-cell assays allow monitoring of cell responses in real time and provide important insights about compound treatment effects and biological complexity. We used real-time quantitative cell imaging assays with the ImageXpress® Pico Automated Cell Imaging System to monitor complex effects of anti-cancer compounds in cell models.
To characterize the effects of anti-cancer compounds, we monitored the time-dependent effects on cell proliferation and cell cycle for HeLa cervical cancer cells. An environmental control (EC) chamber was used to deliver desired CO2and O2concentrations. Time-lapse imaging in transmitted light was used to quantify cell number, confluency, and cell area, while fluorescent markers were used to evaluate the effects of compound treatment on cell cycle.
Cell-based assays were performed using the ImageXpress Pico system in combination with CellReporterXpress®Imaging Acquisition and Analysis Software. The imager provides five fluorescence channels plus transmitted light (brightfield) as well as colorimetric imaging. The environmental control chamber and high-stage precision supports long-term, time-lapse microscopy to enable automatic monitoring of cell proliferation, differentiation, compound toxicity, and a variety of other cell-based assays.
Methods
Environmental control and time-lapse monitoring
ImageXpress Pico system is equipped with an environmental control chamber that enables control and monitoring of temperature, CO2and O2concentrations, as well as humidity. In combination with time-lapse imaging it provides an efficient tool to perform live experiments, including hypoxia conditions.
Cell culture
HeLa cells (obtained from ATCC) were plated into 384-well black, clear-bottom microplates (Corning, #3603) at a density of 3,000 cells per well and cultured in the environmental control chamber for 24 hours at 37°C and 4% CO2. Treatment with compounds was performed for 24 hours as indicated in Figures 1 through 4. HeLa cells that were stably expressing histone protein mCherry-H2B and Tubulin-GFP were provided by Dr. Málnási-Csizmadia and were cultured and treated similarly to regular HeLa cells.
Cell imaging
To visualize cells and to monitor cell proliferation and cell death, images were acquired using a 10X objective with transmitted light every one to two hours for 24 hours. Image analysis was performed during image acquisition using a transmitted light cell count general analysis protocol. The analysis provided measurements for numbers of cells, average cell area, and total cell-covered area.
Results
Assessing compound effects on cell viability and proliferation using transmitted light cell count
Phenotypic changes in cell culture were monitored over time by acquiring time-lapse images. Cells were monitored over 24 hours in the EC chamber using transmitted light or fluorescent markers. HeLa cells were plated into 96-well or 384-well microplates at 12,000 or 3,000 cells per well, respectively. Transmitted light images were acquired every one to two hours for 24 hours using a 10X objective, at four sites per well for 96-well plates or one site per well for 384 plates.
Automated image analysis was performed during image acquisition. Image analysis involved finding cells in transmitted light and counting cell number, individual cell area, and area covered by cells (Figure 1). Dead cells were identified based on size and shape and excluded from analysis of healthy cells. Graphing tools were used to view kinetic curves for cell proliferation. Figure 2 shows increase in cell count over a time for each well in a 96-well plate as an indication of proliferation.

Figure 1. Images of HeLa cells acquired with 10X objective by using transmitted light for illumination. The analysis masks for cell count are shown as white overlays (20% of the full image presented). Importantly, the protocol needs to be optimized during the image acquisition, since the analysis protocol cannot be modified or adjusted. Typically, the exposure time is in the range of 1-6 ms, while the focus offset is typically -8.
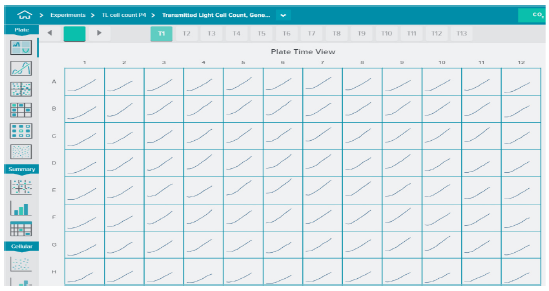
Figure 2. Cell proliferation and compound effects were monitored in real time over 24 hours. Cells were plated into 96- or 384-wells format and placed into the EC chamber. Transmitted light images were acquired every 1-2 hour using 10X objective, four sites per well for 96 wells, or one site per well for 384 wells. Automated image analysis was performed during acquisition. Note the absence of edge effects when using the IX-Pico EC cassette.
Timecourses of the effects of anti-cancer compounds were evaluated using transmitted light imaging and analysis. Compound effects on cell proliferation were monitored in live cells by acquiring images every two hours for 24 hours total. Dose-dependent inhibitions of cell proliferation were observed for staurosporine and mitomycin C (Figure 3). To characterize compound effects, compound EC50values for inhibition of cell proliferation (decrease in cell count) were calculated by using a 4-parameter curve fit algorithm by SoftMaxPro®Software (Figure 3B).
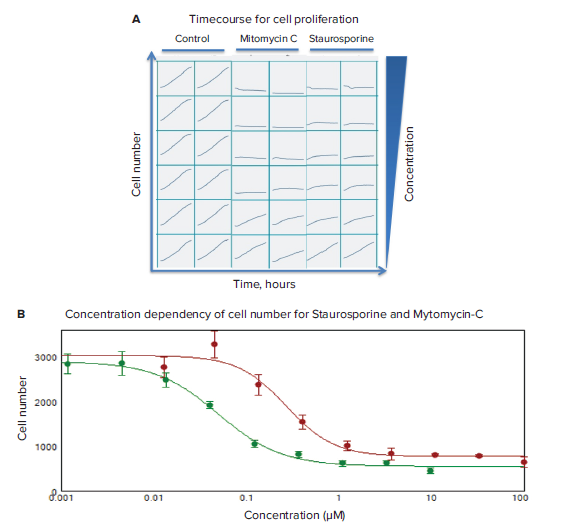
*Figure 3. Timecourse for cell proliferation and concentration dependency of cell number. (A) Timecourse data visualization presented for cell count for control wells and wells treated with increasing concentrations of indicated compounds (duplicate wells). **(B)*Concentration dependencies measured at 24 hours for mitomycin C (in red; IC500.27 μM), and staurosporine (in green, 0.05 μM).
Identification of mitotic cells in real time using fluorescent markers
We monitored cell division in HeLa cells that were stably expressing histone protein mCherry-H2B and Tubulin-GFP. By using fluorescently labeled histones and the cytoskeleton protein tubulin it was possible to follow individual cells progressing through the cell cycle. Figure 4 shows five cells, of which each cell divides within 12 hours. The intercellular bridge and also the forming spindle poles are visible (white arrows). Mitotic cells with small and bright nuclei can be identified using image analysis. The total number of cells, and cell spreading, can also be monitored by counting all nuclei (H2B-mCherry) and area of GFP (tubulin) stain (Figure 4B).
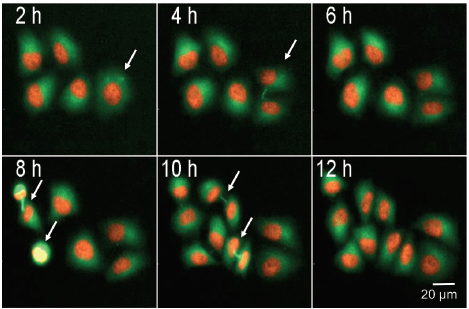
***Figure 4. Live cell detection of mitotic cells.*Image series showing HeLa cells stably expressing mCherry-H2B, Tubulin-GFP undergoing cell division. Mitotic cells indicated with arrows, images were acquired every 2 h for 25 h using 10X objective and FITC and TRITC illumination. Percentage (%) of mitotic cell can be counted by calculating the ratio between total cell number and number of mitotic cells
Conclusion
Overall, our results demonstrate how environmental control chamber and time-lapse imaging of live cells can be utilized for monitoring cell division and evaluation of compound effects in real time. Image analysis on the fly provides automated monitoring of cell culture and phenotypic changes of cells during the experiment. Finally, time-lapse data can be easily exported into MP4 format and saved as a video.
介绍
Oksana Sirenko, PhD | Sr. Research Scientist | Molecular Devices
Felix Spira, PhD | Applications Scientist | Molecular Devices
András Málnási-Csizmadia, PhD | Professor | Eötvös Loránd University, Hungary
生物研究和药物发现越来越需要扩大基于 细胞的检测方法的多样性和复杂性。活细 胞检测可以实时监测细胞反应,并提供关 于化合物治疗效果和生物复杂性的重要见 解。我们使用 ImageXpress®Pico 自动细 胞成像系统进行实时定量细胞成像分析, 以监测细胞模型中抗癌化合物的复杂效 果。
为了描述抗癌化合物的作用,我们监测了 HeLa 宫颈癌细胞增殖和细胞周期的时间依 赖效应。环境控制 (EC) 室用于提供所需的 CO2 和 O2 浓度。采用透射光延时成像技术 对细胞数量、融合度、细胞面积进行量 化,采用荧光标记技术评价化合物处理对 细胞周期的影响。
使用 ImageXpress Pico 系统结合 CellReporterXpress® 成像采集和分析软件进行细 胞检测。该成像设备提供五个荧光通道加 上透射光 (brightfield) 以及比色成像。环 境控制室和高精度自动移动台支持长时 间、延时显微成像技术,可自动监测细胞 增殖、分化、化合物毒性和各种其他基于 细胞的检测。
方法
环境控制和延时监测
ImageXpress Pico 系统配备了一个环境控 制室,可以控制和监控温度、CO2 和 O2 浓 度以及湿度。与延时成像相结合,它提供 了一个有效的工具进行现场实验,包括缺 氧条件。
细胞培养
HeLa 细胞 ( 取自 ATCC ) 以每孔 3000 个 细胞的密度培养在 384 孔黑色透明底微孔 板 (Corning, #3663),在 37℃ 和 4% CO2 的环境控制室中培养 24 小时。化合物处理 24 小时,如图 1-4 所示。稳定表达组蛋白 mCherry-H2B 和 Tubulin-GFP 的 HeLa 细胞由 Málnási-Csizmadia 博士提供,并 与正常 HeLa 细胞进行类似的培养和处理。
细胞成像
为了使细胞成像结果可视化,并监测细胞 增殖和细胞死亡,在 24 小时内,每隔 1 至 2 小时用透射光 10X 物镜获取图像。在图 像采集过程中使用透射光细胞计数通用分 析 protoco (Transmitted light cell count general analysis) 进行图像分析。分析提 供了细胞数量、平均细胞面积和总细胞覆 盖面积的测量。
结果
利用透射光细胞计数评估化合物对细胞活 力和增殖的影响
通过获取延时图像,监测细胞培养的表型 变化。用透射光或荧光标记物在 EC 室中 对细胞进行 24 小时以上的监测。将细胞分 别铺到 96 孔或 384 孔板中,每孔分别为 12,000 细胞或 3,000 细胞。使用 10X 物 镜,每隔一至两小时采集一次透射光图 像,连续 24 小时,96 孔板中每孔成像 4 个位点, 384 孔板中每孔成像 1 个位点。
在图像采集过程中进行自动图像分析。图 像分析包括在透射光下寻找细胞,计数细 胞数量、单个细胞面积、细胞覆盖面积 ( 图 1 )。根据大小和形状识别死亡细胞,以区 分出健康细胞的分析。用绘图工具观察细 胞增殖的动力学曲线。图 2 显示了 96 孔板 中每孔细胞数随时间的增加,以此作为增 殖的指示。
***图 1 利用透射光照明,用 10X 物镜拍摄 HeLa 细胞的图像。*细胞计数的分析掩模显示为白色叠加 ( 占整个图像的 20% )。重要的是由于分析 protocol 无法修改或调整,因此在图像采集过程中需要 对 protocol 进行优化。通常曝光时间在 1-6 毫秒范围内,而对焦偏移量通常为 -8。
***图 2 在 24 小时内实时监测细胞增殖和化合物效应。*细胞培养在 96 孔或 384 孔板中,并放置在 EC 室。利用 10X 物镜,每 1-2 小时采集透射光图像,96 孔板每孔 4 个视野,384 孔板每孔 1 个视野。 在采集过程中进行自动图像分析。注意当使用 IX-Pico 环境控制室时没有边缘效应
利用透射光成像和分析方法对抗癌化合物 的作用时间进行了评价。通过连续 24 小时 每两小时采集一次活细胞图像,观察化合 物效应对细胞增殖的影响。观察星孢菌素 和丝裂霉素 C 对细胞增殖的抑制作用呈剂 量依赖性 ( 图 3 )。为了表征化合物效应, 利用 SoftMaxPro® 软件中的 4 参数曲线拟 合算法计算出抑制细胞增殖 ( 细胞数量减 少 ) 的化合物 EC50 值 ( 图 3B )。
*图 3 细胞增殖和细胞数量浓度依赖性变化的时间进程。(A) 时间进程数据可视化显示了对照孔和用 增加的指示化合物浓度 ( 重复孔 ) 处理的孔的细胞计数。**(B)*24 小时浓度依赖性检测结果:丝裂霉素 C (红色;IC50 0.27 μM), 以及 星孢菌素 ( 绿色;IC50 0.05 μM )
利用荧光标记实时识别有丝分裂细胞
我们监测了稳定表达组蛋白 mCherry‒H2B 和 Tubulin-GFP 的 HeLa 细胞的分裂。通 过使用荧光标记的组蛋白和细胞骨架蛋 白,可以跟踪单个细胞在细胞周期中的进 展。图4显示了 5 个细胞,每个细胞在 12 小时内分裂。细胞间桥和形成的纺锤体是 可见的 ( 白色箭头 )。核小而明亮的有丝分 裂细胞可以通过图像分析来识别。计数所 有细胞核 ( H2B-mCherry ) 和 GFP 染色面 积 (tubulin) 也可以监测细胞总数和细胞扩 散 ( 图 4B )。
***图 4 有丝分裂细胞的活细胞检测。*图像系列显示 HeLa 细胞稳定表达 mCherry-H2B, Tubulin-GFP, 正在进行细胞分裂。用箭头表示有丝分裂细胞,在 10X 物镜、FITC 和 TRITC 光照下,每 2 小时采集 一次图像,持续 25 小时。通过计算有丝分裂细胞总数与有丝分裂细胞数的比值,可以计算出有丝分 裂细胞的百分比(%)
结论
总的来说,我们的研究结果证明了环境控 制室和活细胞延时成像技术可以用于实时 监测细胞分裂和评估化合物效应。在实验 过程中,On the fly 即时分析的图像分析 提供了细胞培养和细胞表型变化的自动监 测。最后延时数据可以很容易地导出为 MP4 格式,并保存为视频。