
Application Note
High-speed phenotypic profiling using a next generation high-content imaging platform with AI-enabled image analysis
- Improve image acquisition speed up to 100% with a next-generation imager, the ImageXpress HCS.ai High-Content Screening System
- Enhance cell segmentation accuracy using AI-driven image analysis workflows.
- Yield high z scores across assays, validating the ImageXpress HCS.ai System’s performance in high-throughput screening workflows.
Angeline Lim | Product Manager, Imaging | Molecular Devices
Zhisong Tong | Research Scientist | Molecular Devices
Introduction
High-content imaging plays a pivotal role in modern drug discovery by enabling the simultaneous capture of multiple cellular features—offering a more comprehensive view of cellular responses to perturbations than single-parameter assays. To advance this capability, we developed the nextgeneration ImageXpress® HCS.ai High-Content Screening System (Molecular Devices), featuring a fully reengineered hardware and software platform. Enhanced x, y, and z stage movement and adaptive autofocus deliver greater throughput, while a state-of-the-art optical light path— including optimized illumination and a high-quantumefficiency camera—enables reduced exposure times, lower background, and a significantly improved signal-tonoise ratio.
In this application note, we present two representative assays to demonstrate how the newly engineered imager and its modern software interface enable a streamlined, end-to-end workflow—from acquisition setup to advanced data analysis. Both assays yielded Z-prime scores above 0.5, underscoring the system’s robustness and suitability for high-content screening:
- G-protein coupled receptor (GPCR) assay
- Cell painting assay
On average, we observed a 100% improvement in image acquisition speed with the ImageXpress HCS.ai System compared to leading high-content imaging platforms. This gain in throughput, combined with exceptional image quality, positions the system as an ideal solution for both 2D and 3D high-throughput imaging applications.
Methods
Cell culture and staining
G-protein coupled receptor assay
U2OS cells expressing GFP tagged ß-arrestin were seeded into a 384 well flat bottom plate (Greiner) and cultured in Dulbecco’s Modified Eagle Medium (DMEM, Thermo Fisher Scientific) for 1 day and then treated with isoproterenol, a GPCR agonist (SelleckChem) for one hour. After treatment, the cells were stained with Mitotracker Deep Red (Thermo Fisher Scientific) and Hoechst (Thermo Fisher Scientific), followed by fixation with 4% paraformaldehyde (PFA, Thermo Fisher Scientifc). The fixation solutions were removed and washed with PBS twice before ready for imaging.
Cell-painting assay
MCF-7 human breast cancer cells (ATCC) were passaged and maintained according to the manufacturer’s recommendations. The Cell Painting assay was performed based on the protocols from Bray et al1 and Cimini et al• Briefly, MCF7 cells were seeded in Greiner 384-well μClear plates at 2000 cells per well in a total of 40 μL of MEM media (supplemented with 10% FBS, 10ug/ mL insulin). Cells were incubated at 37°C for 24 hours before compound treatment. The culture medium was replaced with 2% (vol/vol) FBS in MEM 24 hours after seeding and before compounds were added. The following 11 compounds were used here: 5-Fluorouracil, Ca-074-Me, CCCP, chloroquine (Enzo), cytochalasin D, etoposide (Calbiochem), latrunculin B, rotenone (Enzo), staurosporine, and tetrandrine (unless indicated, all compounds were purchased from SelleckChem). Compounds were tested in quadruplicate wells in a seven point, 1:3 dilution series. DMSO controls, negative, and positive controls were included in the same plate. Cells were incubated with the compounds for 24 hours. Live cells were stained with MitoTracker DeepRed (500 nM) for 30 min in the dark at 37°C, then fixed with PFA (3.2% vol/vol) for 20 min. Cells were washed and then permeabilized with triton-100 (0.1%) at room temperature for 20 min. Staining solution was prepared at the following concentrations: 5 μg/mL phalloidin, 100 μg/mL concanavalin A, 5 μg/mL Hoechst, 1.5 μg/mL WGA and 3 μM SYTO 14 dye in blocking solution (1X HBSS and 1% wt/vol BSA). Cells were washed and incubated with the staining solution for 30 min at room temperature. Staining solution was removed and cells were washed three times and then sealed with adhesive foil. All wash steps were performed with 1X HBSS.
Image acquisition and analysis
G-protein coupled receptor assay
Images were acquired on the ImageXpress HCS.ai High-Content Screening System (Figures 1,2) using 20X magnification, confocal option 60” disk, in DAPI, FITC and TL channels. Maximum projection images from Z-stacks of 5 planes with 1um step size were acquired. The segmentation of nuclei and GPCR puncta was done with IN Carta® Image Analysis Software with builtin segmentation tools and counted to generate dose response curve.
Cell-painting assay
Images were acquired on the ImageXpress HCS.ai High-Content Screening System (Figures 1, 2) using 20X magnification, confocal option 60” disk. Maximum projection images from Z-stacks of 13 planes with 2um step size were acquired. Images were analyzed using IN Carta Image Analysis Software. SINAP was used for nuclei segmentation. 246 measurements per cell from the assay were uploaded to the StratoMineR™ software for further analysis.
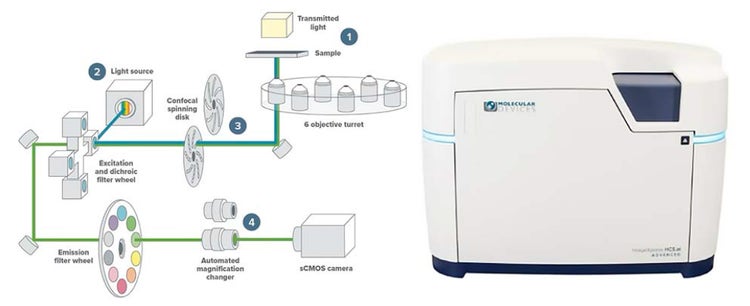
Figure 1. The ImageXpress HCS.ai System is redesigned with improved optics and hardware to support fast image acquisition without compromising image quality. 1) It supports standard SBS format labware and slides, 2) offers either laser or LED light source, 3) has four spinning disk geometry options available, 4) automated magnification changer offers up to 12 effective magnifications in one system (including four water immersion options)
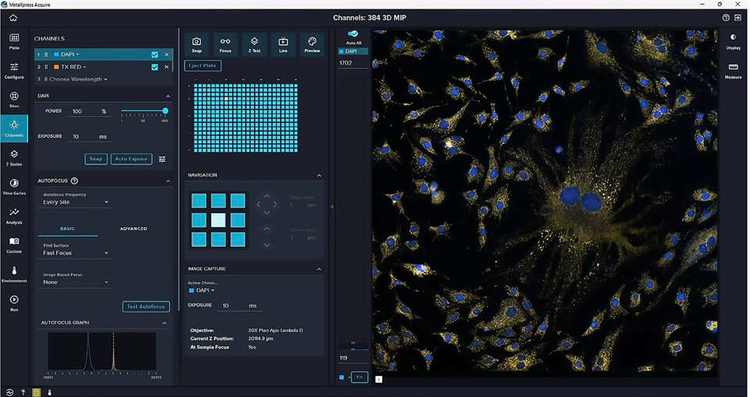
Figure 2. Redesigned image acquisition software (MetaXpress® High-Content Image Acquisition and Analysis Software) offers an intuitive, user-friendly environment that is quick for novices to master while remaining flexible and customizable for advanced users. There are also several new features, including easily controlled transmitted light acquisitions and identification and the centering “rare” objects in a well for high magnification acquisition.
Results
Up to 50% shorter image acquisition times
The ImageXpress HCS.ai System is designed for speed and assay flexibility. To assess imaging speed, we conducted a comparative evaluation of image acquisition times across multiple settings, benchmarking our system against other leading high-content screening imagers. Acquisition time was on average 50% shorter for images acquired in widefield, indicating 100% faster, and 38% shorter for images acquired in confocal, indicating 61% faster. (Figure 3.) For the cell painting assay, acquisition was completed under 96mins (confocal, water immersion, 4FL channels + TL) compared to other similar systems which took ~162 mins.
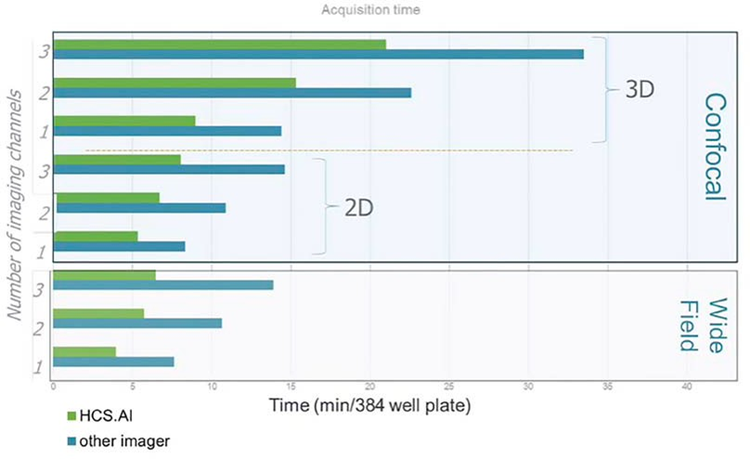
Figure 3. Average acquisition speeds of three runs for each image acquisition set up shown (four instruments, 20X). For 3D imaging, 5 Z-planes were acquired while for 2D imaging, 1 focused plane was acquired. For widefield speed tests, only 2D imaging was performed. Speed comparisons were made using the same exposure time between systems, under these settings the ImageXpress HCS.ai System had at least 2X brighter pixel intensities and at least 2X signal:noise ratio improvement.
Assay performance: GPCR Assay (Transfluor®)
G-protein coupled receptors (GPCRs) represent the largest class of pharmaceutical targets and are widely utilized in cellbased screening assays. Upon GPCR activation, ß-arrestin in the cell cytoplasm translocate to pits and endocytic vesicles (Figure 4A). Here, U2OS cells expressing GFP tagged ß-arrestin were treated with isoproterenol (GPCR agonist) which allows for imaging and analysis of internalized GPCR vesicles using high-content imaging.
Precise cell segmentation is crucial for accurately counting vesicle puncta and quantifying dose response. IN Carta Image Analysis Software features Cellpose 3.0 to achieve accurate cell segmentation and displays masks in random colors to distinguish adjacent cells (Figure 4B). Cellpose is a deep learning-based algorithm for cellular segmentation from a wide variety of image types without needing to be retrained. This allows it to handle images with varying noise, blur, and contrast, and works across different channels and varying sizes.
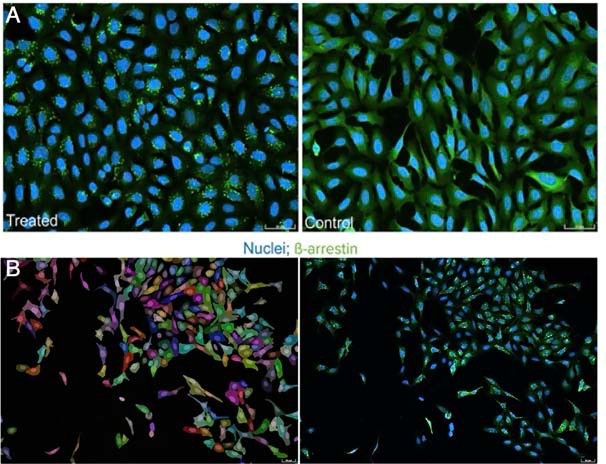
Figure 4. Evaluation of the GPCR assay. (A) Cells with activated GPCR (treated with isoproterenol) shown on the left, negative control on the right. Note the presence of ß-arrestin punctae (green) in the treated samples. (B) Cell masks in random colors, generated using Cellpose 3.0 in the IN Carta image analysis software, were based on DAPI staining and vesicles staining
The number of GFP puncta was used to calculate the Z-prime score for the assay (0.75 and 0.67) (Figure 5B).
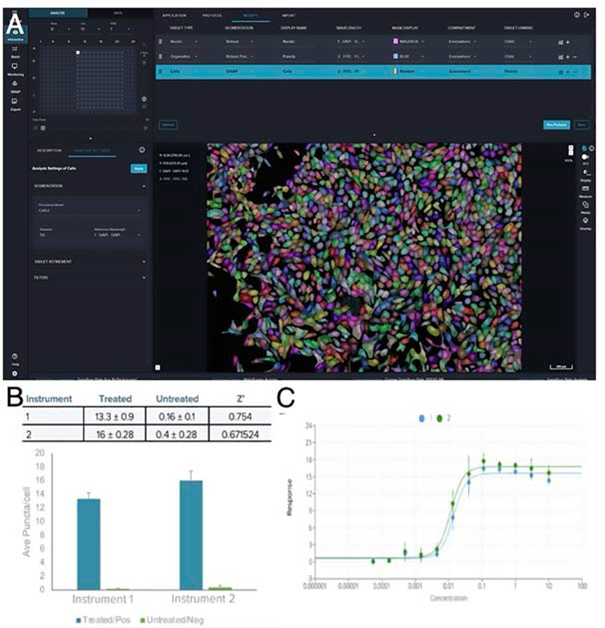
Figure 5. Images were analyzed using IN Carta image analysis software. A) The image analysis protocol: Nuclei was segmented with Robust on DAPI channel; Vesicle was segmented with Robust Puncta on FITC channel; Cell was segmented with Cellpose 3.0 on FITC channel with reference to DAPI channel. B) Average of 8 technical replicates from two HCS.ai systems shown. C) The dose-dependent increase in the number of puncta, showing activation of G-PCR pathway in response to isoproterenol. EC50 = 0.014 (1), 0.011 (2). (Dose response curve generated using Quest Graph™ Four Parameter Logistic (4PL) Curve Calculator. AAT Bioquest, Inc., 7 Jan. 2025)
Cell painting
Cell painting is a high-content, multiplexed imaging assay that employs up to six fluorescent dyes to label and visualize eight distinct cellular components. This approach has proven highly effective for characterizing cellular phenotypes, serving as a proxy for cell state, gene expression, and even drug mechanism of action. In this example, MCF7 breast cancer cells were treated with a small compound set and subsequently analyzed using the cell painting assay (Figure 6).
Multiplexed assays, such as cell painting, require imaging across multiple fluorescent channels. The ImageXpress® HCS. ai System (Advanced Model) is equipped with a 7-color laser and 8 fluorescent channels, making it well-suited for highly multiplexed studies. In this example, images were acquired using the HCS.ai System and analyzed with IN Carta® Image Analysis Software.
All measurements from IN Carta Image Analysis Software were uploaded to StratoMineR™ Software, a cloud-based platform developed for the analysis of multiparametric data such as in phenotypic profiling assays. Data analysis was carried out for multidimensional phenotypic profiling. Data reduction using uniform manifold approximation and projection (UMAP) revealed that cells treated with the same compounds clustered together. Phenotypic distance scores further demonstrated that cells treated with doxorubicin, staurosporine, latrunculin, and tetrandrine exhibited significantly different profiles compared to untreated controls.
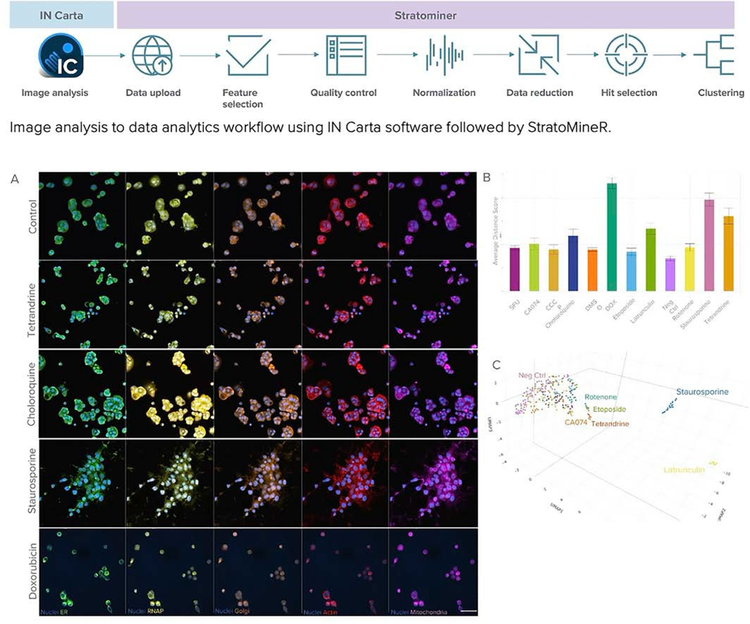
Figure 6. Cell painting assay on the ImageXpress HCS.ai System. A) Representative images of control and treated MCF7 cells. Scale=50µm. Images were analyzed using IN Carta Image Analysis Software. SINAP was used for nuclei segmentation. 246 measurements per cell from the assay was uploaded to the StratoMineR software for further analysis. B) Graph showing the average physical distance score for compounds used. C) UMAP representation of the phenotypic profiles.
Conclusion
- The newly designed ImageXpress HCS.ai High-Content Screening System achieved up to a 100% increase in acquisition speed on average, significantly accelerating screening workflows compared to other leading systems.
- The IN Carta Image Analysis Software features Cellpose 3.0 for accurate cell segmentation with varying noise, blur, and contrast.
- The The ImageXpress HCS.ai System supports highly multiplexed assays and enabled clear clustering based on distinct phenotypic profiles.
- Both assays produced high Z’ scores (>0.5), demonstrating the ImageXpress HCS.ai System’s suitability for robust, high-throughput screening applications.
References
- Bray MA, Singh S, Han H, Davis CT, Borgeson B, Hartland C, Kost-Alimova M, Gustafsdottir SM, Gibson CC, Carpenter AE. Cell Painting, a high-content image-based assay for morphological profiling using multiplexed fluorescent dyes. Nat Protoc. 2016 Sep;11(9):1757-74. doi: 10.1038/ nprot.2016.105. Epub 2016 Aug 25. PMID: 27560178; PMCID: PMC5223290.
- Cimini BA, Chandrasekaran SN, Kost-Alimova M, Miller L, Goodale A, Fritchman B, et al. Optimizing the cell painting assay for image-based profiling. Nat Protoc 2023; 18:1981–2013. https://doi.org/10.1038/s41596-023-00840-9.