
Application Note
Using a next-generation high-content screening platform and AI-analysis tools to increase insights from the complex 3D assay
- Achieve exceptional image quality in thick 3D samples with over 4-fold improvement in signal-tonoise when using Deep Tissue Spinning Disk
- Capture high-resolution images from targeted objects quickly and efficiently with QuickID™ Targeted Acquisition
- Quantify dose dependent responses in apoptosis and organoid morphology using AI-enabled segmentation and classification tool
Zhisong Tong, Angeline Lim | Molecular Devices, LLC
Introduction
Next-generation high-content imaging
Image-based high-content screening (HCS) is a potent drug discovery strategy that characterizes drug effects through the quantification of image-based features that describe cellular changes within or among cell populations. With the rising interest in 3D biological models, there is an increasing demand for an imaging platform that not only acquires high-throughput, high- quality images in 3D samples, but also enables advanced complex image analysis that allows to capture essential information from more complex biological assays. Here, we introduce the next generation in high-content imaging, the ImageXpress® HCS.ai High-Content Screening System. The system is equipped with flexible confocal spinning disk options, modular hardware, and a new, intuitive software interface, MetaXpress® Acquire. The new imager is designed to capture high quality images and data, increase speed of acquisition and use integrated software tools to enable seamless setup of imaging and complex analysis in an intuitive way.
Drug efficacy and toxicity testing often rely on immortalized cell lines or animal models that don’t closely mimic complex human biology. This can lead to inaccurate predictions of a drug’s potential and extended drug development timelines. However, retrospective studies confirm a high degree of similarity between the phenotype and genotype of a patient-derived organoids (PDO) and an original patient tumor. In this application, we cultured patient-derived colorectal cancer (CRC) organoids embedded in an extracellular matrix (ECM) layer and show dose-dependent effect in organoid morphology and cell viability after treatment with anti-cancer drugs. We show use of QuickID™ Targeted Acquisition and Deep Tissue Confocal Spinning Disk as an acquisition tool to obtain high resolution images of 3D structures. The images were analyzed using a user-trained deep learning segmentation model in IN Carta® image analysis software to generate multiparametric data to quantify phenotypic effects of compounds.
Overall, the ImageXpress HCS.ai system renders fast, high-throughput acquisition and high-quality images using an intuitive software interface. These combined improvements to acquisition speed, image quality, and machine learning-assisted analysis enable the use of more assays and models for both research and 3D drug screening.
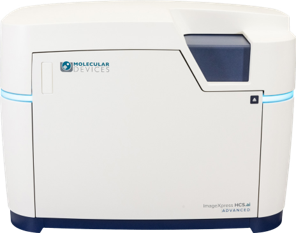
Figure 1. ImageXpress HCS.ai High-Content Screening System.
Methods
Cell culture and staining
Colorectal 3D Ready™ Organoids (Molecular Devices) were used for phenotypic evaluation of compound effects. Organoids were provided in cryopreserved vials, then thawed, and seeded into IBIDI 96 well plates (Ibidi) as organoid domes mixed with 80% Matrigel (Corning Life Sciences), 15 µl per well. Organoids were cultured in a base media (DMEM/F12 with Glutamax, HEPES, Pen/strep) supplemented with N2, B27 and N-acetyl cysteine according to recommended protocol (Thermo Fisher Scientific). Rock inhibitor was used in the media to aid in recovery of organoids, after which the media was replaced with supplemented base media without rock inhibitor. After 48 hours, organoids were treated with selected compounds for 5 days. Organoids were dosed with the following compounds, in 4-fold dilution series, in triplicates. Concentrations were used as following 5-Fluorouracil (5FU, 1000 µM), Chloroquine (100 µM), Trametinib (100 µM). Doxorubicin (100 µM) was used as positive controls. All reagents were from Sigma LifeSciences.
After treatment, MitoTracker reagent (Thermo Fisher Scientific) was added to the media overnight, following which they were fixed with 4% formaldehyde (Sigma LifeSciences) and after that stained with Alexa Flour 488 Phalloidin (1:200) and Hoechst 33342 (1:500) nuclear dye in the presence of 0.1% of Triton X (Sigma LifeSciences).
Results
QuickID Targeted Acquisition enables efficient capture of high resolution images
Imaging CRC organoids cultured in Matrigel is challenging due to their random distribution, which complicates high-magnification imaging. Since high-magnification fields of view cover only a small area, there’s a significant risk of capturing regions without organoids, reducing imaging efficiency and increasing storage space. MetaXpress® Acquire Software includes an integrated QuickID Targeted Acquisition workflow, allowing users to automatically identify and re-image objects of interest at higher magnification. Initial detection is performed at low magnification with real-time image analysis, enabling precise and efficient high-resolution targeting (Figure 3). To demonstrate this process, CRC organoids were first imaged at 4x magnification using automatic image stitching to acquire the whole area of the well. Stitched images were analyzed using IN Carta Image Analysis Software and the analyzed output used to determine regions of interest (ROI) for the high magnification acquisition. These regions were then imaged at either 20X or 40x magnification with water immersion objectives to obtain high resolution data with objects centered in the field of view. For objects larger than a single field of view, multiple regions were automatically calculated and stitched together to capture the whole object.
Image acquisition and analysis
Images were acquired using the ImageXpress® HCS.ai Advanced High-Content Screening System (Figure 1) at 10X magnification. The system was configured with either the user-exchangeable Standard Spinning Disk Confocal module (60 μm pinhole) or the Deep Tissue Spinning Disk Confocal module, featuring a dual-disk design with 50 μm pinholes and selectable High Resolution or High Sensitivity geometries. Z-stacks were captured over a 200 μm total imaging depth with 10 μm intervals between planes. Maximum intensity projections were generated for subsequent 2D analysis. Organoids were defined and segmented using the SINAP (Segmentation Is Not A Problem) module in the IN Carta Image Analysis Software (Figure 2). A customized deep learning segmentation model was trained using acquired brightfield images, which were rapidly annotated with the SAM (Segment Anything Model) tool. Following segmentation, analysis was conducted to extract hundreds of quantitative features—including fluorescence intensity, area, texture, and other morphological measurements—across multiple imaging channels. Organoids were then phenotypically classified using the Phenoglyphs™ module, with two user- defined classes: intact and damaged.
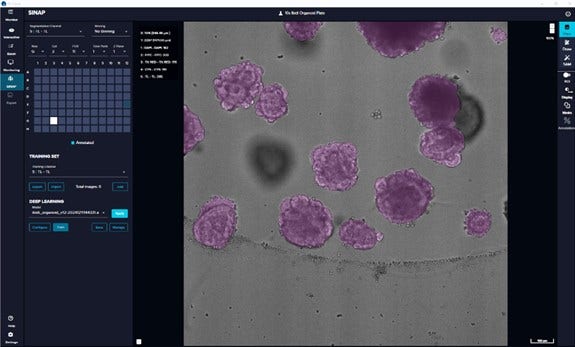
Figure 2. IN Carta Image Analysis Software includes two major modules: SINAP (Segmentation Is Not A Problem) is a deep learning based image segmentation module that allows users to customize their own model using training image sets, equipped with SAM (Segment Anything Model) tool; Phenoglyphs is a machine learning based customizable data classifier, whose user-in-the-loop training mode allows users to visually annotate the object based on its phenotype and reassign misclassified objects in the training.
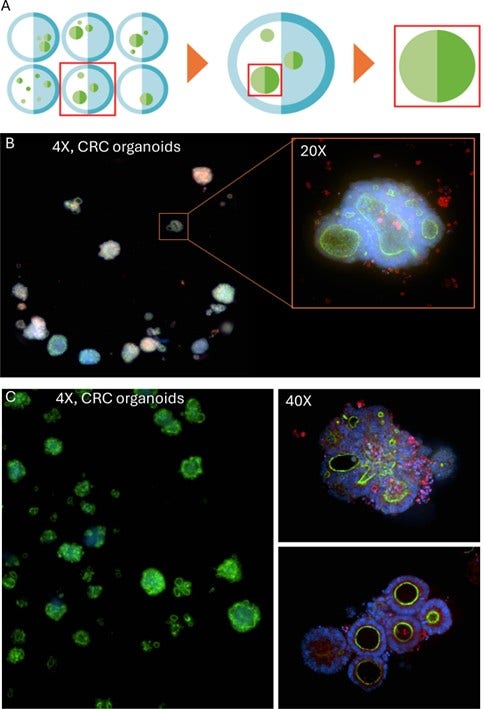
Figure 3. A. QuickID workflow: low-magnification preview scan to capture the objects, followed by analysis to determine the regions of interest, then high-magnification acquisition used to capture high-resolution image or targeted objects. B. CRC organoids were imaged with QuickID with 4X objective, followed by IN Carta analysis to identify organoids using simple thresholding in the DAPI channel. Next, the 20X objective was used to acquire high- resolution images. C. The 40X objective was used to acquire high-resolution images using the same sample as in Figure 3B.
Deep Tissue Disk ensures high signal-to-noise ratio
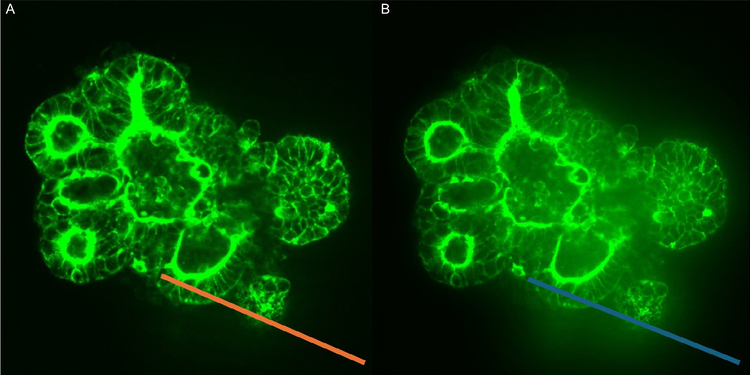
An additional challenge in 3D organoid imaging stems from the increased sample thickness, which reduces the signal-to-noise ratio at deeper imaging planes. Spinning disk confocal imaging provides high speed of image acquisition but conventional systems can be limiting due to the fixed pinhole sizes and fixed spacing geometry. The ImageXpress HCS.ai System features AgileOptix™ spinning disk confocal technology which allows users to swap between different spinning disks and optimize for acquisition speed and imaging quality. The Standard Confocal Spinning Disk uses a 60 µm pinhole and is a versatile all-round option suitable for a variety of assays. The optional Deep Tissue Confocal Spinning Disk utilizes a smaller 50 μm pinhole size with a two disk configuration, software controlled switching, and offers two geometries optimized for High Sensitivity (HS) and High Resolution (HR) image which are optimized for higher magnification objectives and minimize pinhole crosstalk with thicker 3D samples. Here, we demonstrate improved image quality obtained with the Deep Tissue Disk compared to the Standard Disk when imaging through a cross section of a CRC organoid (Figure 4). Quantitation of the line scan shows an average signal-to-noise ratio (SNR) improvement of 4.5 in the image acquired with Deep Tissue Disk.
Signal to noise ratio of line scan
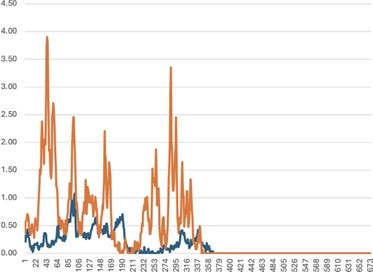
Figure 4. A. CRC image acquired with 50um pinhole deep tissue disk; B. CRC image acquired with 60um pinhole confocal disk; C. Signal to noise ratio analysis in the line scan measurement shown in Figure 4A and 4B.
3D Ready Organoids were used to demonstrate an “off-the-shelf” solution to screen a physiologically relevant, patient-derived organoid model with a high assay consistency. Organoids were seeded on the liquid handling deck of the CellXpress.ai Automated Cell Culture System. The seeded organoids were first treated with compounds (5FU, Chloroquine and Trametinib), then stained, fixed and imaged using the ImageXpress HCS.ai System with Standard Confocal Optics with 60um pinhole size (Figure 5A).
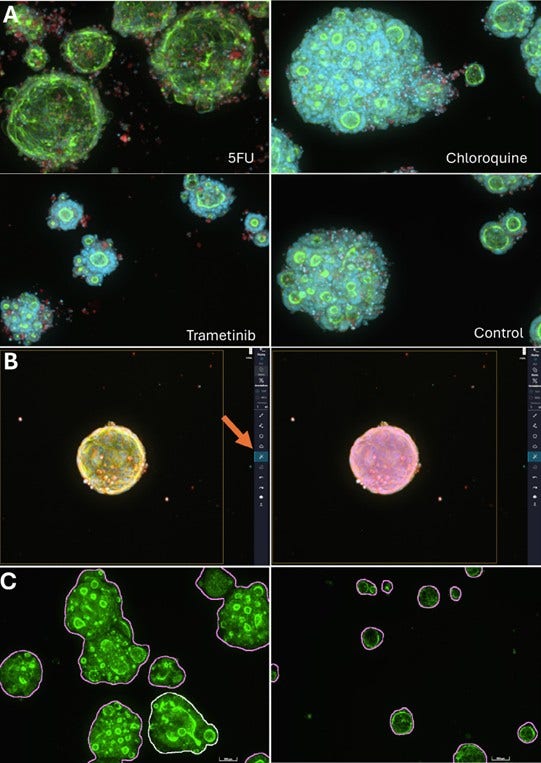
Figure 5. A. Representative image of the CRC organoids treated with 5FU, Chloroquine, Trametinib and control, respectively; B. One-click SAM tool showing the accurate segmentation of the organoid; C. Example segmentation masks of organoids of various sizes generated using a customized AI model within the SINAP module, shown with magenta outlines.
F-actin can be found at cell-cell contact sites and is important for maintaining cell adhesion. CRCs from the untreated control group exhibited a ring F-actin surround the lumen, as shown by phalloidin staining. However, 5FU treated organoids do not show the distinct phalloidin ring suggesting that 5FU disrupted organoid organization. This was further supported by the observation that these organoids have fewer cells, as shown by decreased DAPI staining. Trametinib treated organoids were smaller than untreated controls and still maintained an intact structure, suggesting that trametinib has a cytostatic effect on the organoids and prevents their growth, while organoids treated with chloroquine reveal phenotypes similar to the control group, suggesting minimal impact on their growth or morphology. The organoids from positive control group are damaged by doxorubicin and not stained with Phalloidin (data not shown).
Segmentation is the first step in the image analysis workflow, where individual objects are identified and separated by distinct boundaries. AI-based segmentation tools can help deliver robust segmentation results, however fixed turnkey AI-models can be limited in the range of samples types they can accurately segment and re-training of models can be a time consuming process to annotate data training sets. IN Carta Image Analysis Software features SINAP, a deep learning-based segmentation module to quickly build segmentation models that can be used as part of the normal Flexi Protocol workflow. Here, a customized model was created to accurately segment whole organoids using SINAP. This tool features the Segment Anything Model (SAM) for one-click segmentation for most objects and the ability to quickly correct parts of the mask to rapidly build the training dataset for the AI model (Figure 5B, 5C). Organoids were segmented, morphological measurements extracted per organoid, and the average area plotted across all concentrations (Figure 6C). Consistent with the above observations, trametinib treated organoids are on average 50% smaller than the controls, suggesting trametinib inhibits the growth of the organoids and only show minor growth at the lowest concentration. The average size of the organoids treated with chloroquine was similar in size to the control group, indicating minimal impact of chloroquine on the organoids. The 5FU data indicated change in morphology, and also a reduction in organoid size with increasing compound concentration.
As described above, 5FU clearly shows dose-dependent size reduction and morphology of lumen rings, and a disruption of that structure with higher concentration. Considering complexity of morphological changes, we anticipated that a single feature like area would not be enough to quantify the overall phenotype change. To better characterize the complex effect, 386 measurement were selected to use with the Phenoglyphs module in IN Carta Image and Analysis Software, a supervised machine learning classifier with user defined classes, and built a customized AI classifier based on 5FU treated organoids, which classified organoids as ‘intact’ and ‘morphologically impacted’. The Phenoglyphs module in IN Carta Software implements multiple tools to help users to build a customized AI model. For example, clearly identified visual exemplars help the user categorize objects, and a model quality metric indicates the accuracy of the trained model (Figure 6A). A dose response curve was used to display the percentage of ‘morphologically impacted’ organoids (Figure 6B). In this proof-of-principle study, we focused on organoids treated with 5-fluorouracil (5FU) and chloroquine. The EC₅₀ of 5FU was calculated to be 128 µM, indicating a measurable dose-dependent effect, while chloroquine showed minimal impact under the tested concentration and exposure duration. Feature ranking (Figure 6A) identified area as the most influential parameter for classification, consistent with visual observations.
Additional features—including gyration radius, chord ratio, compactness, elongation, and form factor—were also analyzed to capture nuanced morphological changes and enable accurate quantification of the complex phenotypic response to compound treatment.
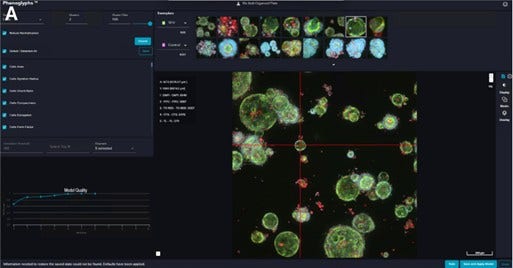
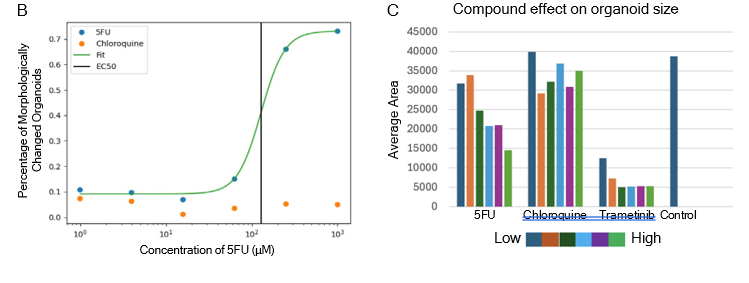
Figure 6. A. Phenoglyphs screenshot showing two chosen classes, the ranking features, model quality and the exemplars; B. EC50 calculation of dose response curve based on the percentage of compound impacted organoids; C. Trend of average area across compound concentrations..
Conclusion
This application note showcases a high-content screening assay using a small compound panel and an “off-the-shelf” 3D colorectal cancer patient-derived organoid model. Leveraging advanced AI-driven image analysis, the workflow enables high-accuracy segmentation, robust object classification, and quantification of dose-dependent phenotypic responses. Central to the workflow is the ImageXpress HCS.ai High-Content Screening System—our next-generation imaging platform—designed with enhanced confocal disk geometries and intelligent acquisition capabilities to deliver superior image quality in thick 3D samples. Together with IN Carta Software, this integrated solution offers a scalable, end-to-end approach for generating reproducible, multiparametric data from complex 3D models.