
Application Note
Explore cardiac function by measuring calcium oscillation or contraction patterns
- Record Ca 2 + oscillation in 2D and 3D cardiomyocyte samples
- Analyze complex kinetic patterns
- Measure fluorescence fluctuations over time
- Generate multi-parametric peak data
- Screen compound effects on cardiac function in high-density microplates
Introduction
Matthew Hammer | Applications Scientist | Molecular Devices
Oksana Sirenko, PhD | Senior Research Scientist | Molecular Devices
Understanding the impact of drugs on cardiac system early in the development process is critical to improve the safety of drugs getting to market. Cardiotoxicity is believed to be one of the primary causes of drug attrition during preclinical and clinical trials.1,2 In addition, environmental chemical exposure is a risk factor for cardiovascular disease, yet a number of environmental agents remain inadequately tested for their toxicological effects.3
Human iPSC-derived cardiomyocytes resemble the phenotypes and functionality of primary cardiac cells and circumvent the variability presented by using primary cells. iPSC-derived cardiomyocytes demonstrate synchronous spontaneous contractions that can be modified by drugs and chemical compounds, making them a biologically-relevant model. While the mechanical contractions can be recorded in transmitted light, it has also been shown that disturbance in calcium oscillation patterns, observed using Ca2+ -sensitive fluorescent dyes, can be utilized to measure effects on cardiomyocyte beat rate and pattern.5,6 The method to record and analyze calcium oscillations using time-lapse imaging and the ImageXpress® Micro High-Content Imaging System in iPSC-derived cardiomyocytes has been previously described.4-6
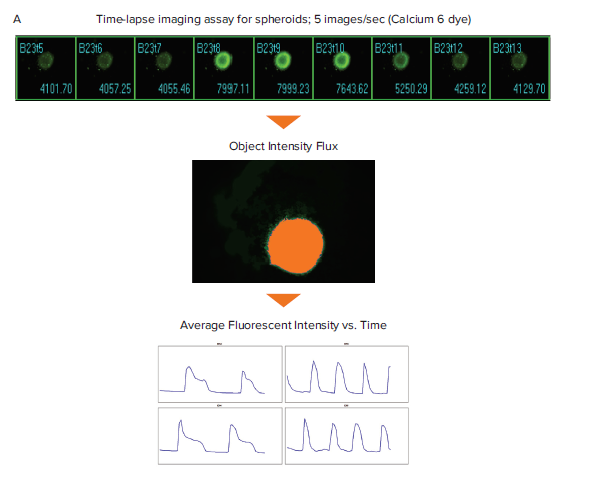
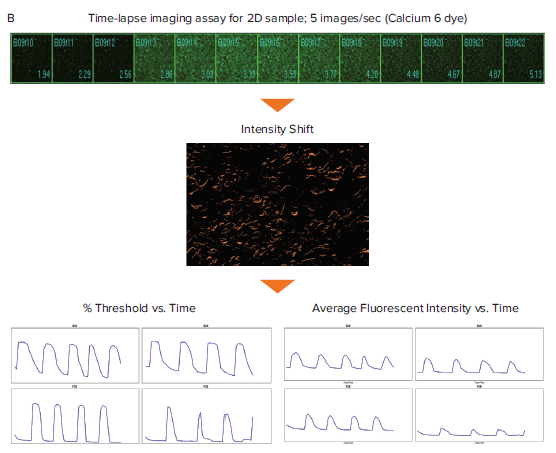
Figure 1. Schematic diagram for the generation of Ca2+ oscillation graphs for spheroid and 2D cardiomyocytes. Filmstrips of time-lapse images of spheroid and 2D iPSC derived cardiomyocytes stained with the Calcium 6 dye. (A) The Object Intensity Flux analysis utilizes the image of the Maximum fluorescent intensity for creating a segmentation mask. This segmentation is applied across the entire stack of time point images for the given spheroid to measure the change in fluorescent intensity over time. (B) The Intensity Shift analysis measures the redistribution of fluorescent signal over time and generates percentage threshold and average fluorescent intensity measurements.
The focus of this technical note is to illustrate the utility of the MetaXpress Peak Analysis tool for the visualization and analysis of Ca2+ oscillation signal traces in 2D and 3D cardiomyocyte samples. We describe the generation of fluorescent intensity data, highlighting the Object Intensity Flux analysis that was run on iPSC-derived cardiomyocyte spheroids. Additionally, we summarize the steps to produce multi-parametric peak readouts including beat rate, peak width, amplitude, and regularity.
Materials
- iCell Cardiomyocytes 2 (FUJIFILM Cellular Dynamics Inc.)
- iCell Cardiomyocytes Plating Medium (FUJIFILM Cellular Dynamics Inc.)
- iCell Cardiomyocytes Maintenance Medium (FUJIFILM Cellular Dynamics Inc.)
- 384-well microplates (Corning, cat. #3712)
- 384-well, low attachment, U-shape microplates (Corning, cat. #3830)
- 0.1% gelatin (Sigma, St. Louis, MO)
- EarlyTox Cardiotoxicity Kit or Calcium 6 dye (Molecular Devices)
- ImageXpress Micro Confocal High-Content Imaging System with MetaXpress® Image Acquisition and Analysis Software, version 6.5 (Molecular Devices)
Methods
Human iPSC-derived cardiomyocytes were cultured according to the manufacturer’s protocols in either 2D or 3D assay formats. For conventional 2D culture, cells were seeded into gelatin-coated plates at 7,000 cells per well in a 384-well microplate. For the 3D format, 5,000 cells were plated in the presence of gelatin in low attachment U-shape 384-well microplates as previously described. Four to five days post plating, the cardiomyocytes were treated with known cardioactive and cardiotoxic compounds at concentrations ranging from 100 μM – 0.3 μM for one hour, 24 hours, and 5 days.6 The cardiomyocytes were then stained with the EarlyTox™ Cardiotoxicity Kit or Calcium 6 dye, both of which measure changes in cytoplasmic calcium levels, a kinetic indicator of the cardiomyocyte contraction. The time-lapse imaging protocol used 3 – 10 ms exposure times, 0.1 – 0.3 sec time intervals, and 60 – 100 total time points, acquiring the entire time series on one well before moving on to the next.6 This fast-kinetic imaging was performed on the ImageXpress Micro Confocal system in widefield mode with the 10X objective and FITC channel.
The MetaXpress Object Intensity Flux and Intensity Shift journals were run on the iPSC-derived cardiomyocyte time-lapse images to generate average fluorescent intensity or percentage threshold data. Journals are macros in MetaXpress software that can be used to automate custom image acquisition, image processing, and image analysis workflows. These journals only require one click to run and analyze oscillation behavior in a variety of cell and assay types. The Object Intensity Flux analysis finds objects and analyzes them for oscillations in fluorescent intensity. Figure 1B shows this analysis on cardiac spheroid images. The Intensity Shift analysis measures redistribution of image fluorescence or brightfield intensity over time. After selecting an appropriate normalization option, this analysis can be performed on label-free recordings of cardiomyocytes captured in transmitted light as well as recordings of fluorescent samples. Figure 1B shows the Intensity Shift analysis on 2D cardiomyocyte images. The fluorescent intensity and percentage threshold data were graphed and used for downstream multiparametric calculations for Ca2+ oscillations (signifying cardiac beating) (Figures 2 and 3).6
Image Analysis
Fluctuating fluorescence intensity of the cells is measured over time
Analysis of cardiac cell beating was run on single plane images of both 2D and 3D cardiomyocyte samples. In this example, spheroids from iPSC-derived cardiomyocytes were imaged at 0.2 sec time intervals for a total of 60 time points on the ImageXpress Micro Confocal system and were analyzed with MetaXpress software using Object Intensity Flux analysis. This analysis identifies the spheroid image of Maximum intensity from a stack of time point images and uses that threshold for segmenting the spheroid. This segmentation is applied to the entire stack of time point images for a given well to measure the average fluorescent intensity (Figure 1).
Data Analysis
Generate multiple parameters using Peak Analysis traces
By plotting Average fluorescence intensity vs. Time in MetaXpress software, the phenotypic responses of intracellular Ca2+ fluctuations to compounds can be easily observed. The oscillation intensity graphs shown in Figure 2 were used to optimize the Peak Analysis settings (Figure 3A) to best represent the traces. If there is well to well variation in intensity, selecting the Dynamic Threshold feature adjusts for the variation in amplitude and slope threshold between peaks in different wells (Figure 3A). This ensures that peaks are found accurately for all wells. The Smooth Width value is the number of data points used for smoothing the peak data and should be high enough to smooth out noise for peak detection. Too high of a value will end up in real peaks not being counted while too low of a value may count noise spikes as peaks. For perfect data without any noise, the smooth width can be set to 1.
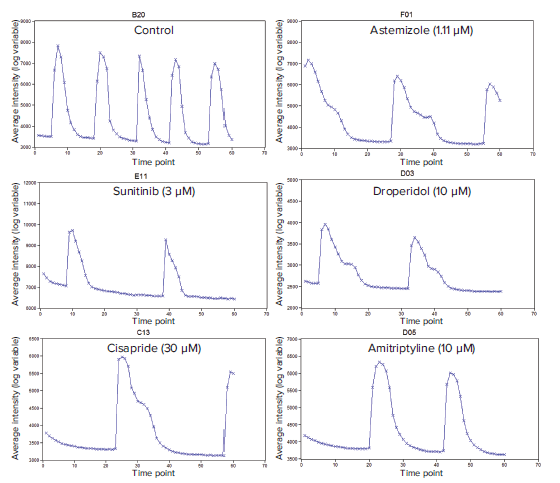
Figure 2. Representative calcium-flux signal traces (average fluorescence intensities) for cardiotoxic compounds. Traces shown are typical phenotypic responses including unaffected regular Ca2+ flux (DMSO control) patterns, and affected astemizole, sunitinib, droperidol. cisapride, and amitriptyline patterns. These traces represent responses of cardiomyocyte spheroids treated for 24 hours.
The Fit Width is the number of data points that account for the width of a peak, which is used for calculating peak measurements such as amplitude and width.
The measurements generated by the MetaXpress Peak Analysis tool can be easily exported into a spreadsheet or text file. Measurements include beat rate, peak amplitude, peak width, rise and decay time, and regularity, providing an in-depth view of changes in cardiac beating rates and patterns in response to compound treatment (Figure 3B).
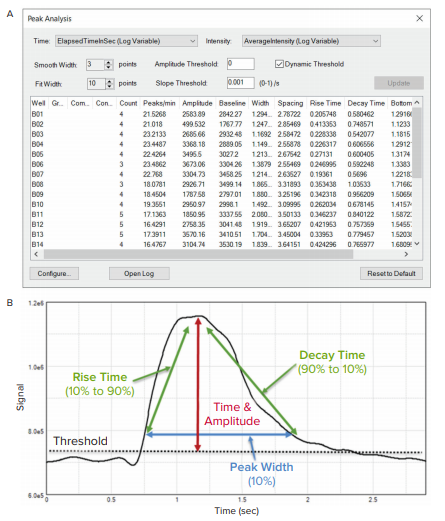
Figure 3. Calcium-flux signal traces (average fluorescence intensities) were analyzed using MetaXpress Peak Analysis. (A) Screenshot of the user interface setup and calculated readouts. Smooth Width and Fit Width were configured to best represent the traces in the displayed cardiac beating graphs. (B) An explanation of the Peak Analysis measurements in relation to a peak.
Conclusion
MetaXpress software, version 6.5 and higher offers the ability to record and analyze complex kinetic patterns, including calcium oscillations, that are representative of cell contraction. The ability to perform fast-kinetic fluorescence imaging of Ca2+ oscillations in 2D and 3D cardiomyocyte cultures with the ImageXpress Micro system and analysis with MetaXpress Peak Analysis tool enables compound screening and research of cardiac function in high-density microplates. This all-in-one package seamlessly combines imaging, analysis, and generation of graphs and data to provide a complete view of cardiac beating profiles in untreated and treated samples for early qualification of drug candidates or evaluation of cardiotoxic effects due to environmental agents
Reference
- Berridge BR, Hoffmann P, Turk JR, Sellke F, Gintant G, Hirkaler G, Dreher K, Schultze AE, Walker D, Edmunds N, Halpern W, Falls J, Sanders M, Pettit SD. Integrated and translational nonclinical in vivo cardiovascular risk assessment: Gaps and opportunities. Regul Toxicol Pharmacol. 2013;65:38–46. Web.
- Laverty H, Benson C, Cartwright E, Cross M, Garland C, Hammond T, Holloway C, McMahon N, Milligan J, Park B, Pirmohamed M, Pollard C, Radford J, Roome N, Sager P, Singh S, Suter T, Suter W, Trafford A, Volders P, Wallis R, Weaver R, York M, Valentin J. How can we improve our understanding of cardiovascular safety liabilities to develop safer medicines? Br J Pharmacol. 2011;163:675–693. Web.
- Judson R, Richard A, Dix DJ, Houck K, Martin M, Kavlock R, Dellarco V, Henry T, Holderman T, Sayre P, Tan S, Carpenter T, Smith E. The toxicity data landscape for environmental chemicals. Environ Health Perspect. 2009;117:685–695. Web.
- Sirenko O, Crittenden C, Callamaras N, Hesley J, Chen YW, Funes C, Rusyn I, Anson B, Cromwell EF. Multiparameter in vitro assessment of compound effects on cardiomyocyte physiology using ipsc cells. J Biomol Screen. 2013a;18:39–53. Web.
- Sirenko O, Cromwell EF, Crittenden C, Wignall JA, Wright FA, Rusyn I. Assessment of beating parameters in human induced pluripotent stem cells enables quantitative in vitro screening for cardiotoxicity. Toxicol Appl Pharmacol. 2013b;273:500–507. Web.
- Sirenko O, Hancock MK, Crittenden C, Hammer M, Keating S, Carlson CB, Chandy G. “Phenotypic Assays for Characterizing Compound Effects on Induced Pluripotent Stem Cell-Derived Cardiac Spheroids.” Assay Drug Dev Technol. 2017 Aug/Sep;15(6):280-296. Web.