
Application Note
Disease modeling methods with cancer patient-derived organoids
- Demonstrate using patient -derived cells for disease modelling
- Automate compound treatment and processing of 3D micro-tissues
- Show multi-parametric approach in analysis compound effects on cancer micro-tumors
Matthew Hammer, Oksana Sirenko | Molecular Devices
Evan F Cromwell | Protein Fluidics, Inc
Margarite Matossian, Matthew E Burow | Tulane University School of Medicine
Introduction
The use of patient-derived tumor tissue has transformed the field of drug and target discovery research, providing a translational tool and physiologically relevant system to evaluate tumor biology. There has been a transition from 2D assays to 3D cell model systems because they more accurately recapitulate the human in vivo environment and are a more predictive tool for drug discovery. An example of this is the use of patient-derived organoids (PDO) for oncology research. PDOs are generated from tumor biopsies or surgical procedures and can serve as models to understand patient-specific drug responses and investigate cancer cell growth. Digested tumor pieces and cells harvested from patient-derived tumors exhibit cancer stem cell (CSC)-like qualities and can be expanded over multiple passages to produce large numbers of organoids that maintain molecular characteristics of the original tumor.1 We present results for breast cancer disease modeling using PDOs formed from primary cells isolated from a patient-derived tumor, TU-BcX-4IC.2 TU-BcX-4IC represents a rare breast cancer subtype, metaplastic breast cancer (MBC), and is classified as a triple negative breast cancer (TNBC) histological subtype. The tumor exhibited rapid pre-operative growth despite combination of neoadjuvant therapy with adriamycin, cyclophosphamide, and paclitaxel. PDOs were incubated in the presence of targeted anti-cancer compounds for 24–48 hours and then stained for either viability markers or E-cadherin/CD44 markers. Resistance of PDOs to chemotherapeutic agents observed in our experiments were consistent with tumor response in the patient. To facilitate this work, we used a Pu·MA System and flowchips for semi-automated organoid assays coupled with high-content imaging. This novel assay method using microfluidics enables automation of 3D cell-based cultures that mimic in vivo conditions and allows a wide range of assay detection modalities. The work described here demonstrates the utility of the Pu·MA System for in vitro drug discovery research in testing structurally delicate 3D systems and can be applied to all solid tumor types.
Pu·MA System assays
Pu·MA System flowchips are designed with chambers and reservoirs arranged in a convenient multi-well plate format (384-well spacings) and provide up to 32 organoid samples per plate. Once tumoroids and reagents are loaded into the flowchips, the plate is placed into the Pu·MA System and reagent exchanges are done automatically through microfluidic channels connected to the protected sample chamber3.
Multiple reagent exchanges are performed with assay protocols using a built-in program. Assay protocols are pre-loaded into the system and run using an intuitive touchscreen interface. The whole Pu·MA System can be placed in an incubator to run assays at 37°C and CO2 (Figure 1). The system architecture and use of pneumatics to move fluids provides gas exchange to the sample chambers to maintain cell health.
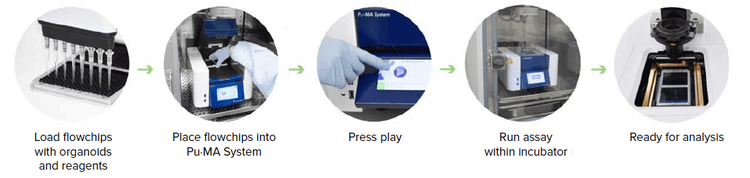
Figure 1. Schematic of the semi-automated tumoroid assay workflow coupled with high-content 3D imaging.
Instrumentation
Pu·MA System and 3D flowchip features:
- Automated media exchanges occur with cells in protected chamber
- Supernatants can be collected to monitor cell secretion
- Cells can be lysed in situ for sensitive metabolomic profiling
- Spheroids can be imaged in the flowchip, or samples removed for immunoassay or metabolomics analysis
The assay protocols can be edited via the Pu·MA System software.
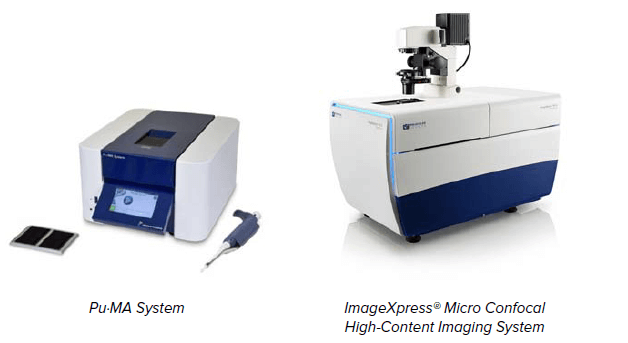
ImageXpress® Micro Confocal HighContent Imaging System includes:
- Five colors + transmitted light
- Environmental control
- Automated data analysis
The system is controlled by MetaXpress® High-Content Image Acquisition & Analysis Software
Tumoroid formation & staining
- Tumoroids were formed from TU-BcX-4IC cells derived from a primary tumor. The tumor exhibited rapid preoperative growth despite combination neoadjuvant therapy with adriamycin, cyclophosphamide, and paclitaxel.
- 4IC cells were dispensed \~2,000 cells per tumoroid and incubated for 72 hours until they formed tight tumoroids. 2 The tumoroids were coated with magnetic nanoparticles4 (NanoShuttle (NS), Greiner Bio-One) to aid in the dispense and placement of the spheres in Pu·MA System flowchips (Figure 2).
- Tumoroids were treated and stained semi-automatically using the Pu·MA System as shown in Figure 4. The system can be used for both viability and immunofluorescence staining.
- Tumoroids were treated with compounds, stained with cell viability markers, and imaged on ImageXpress Micro Confocal system (Figure 3). Image stacks were analyzed for percent Live (calcein AM positive) and Dead (EthD-1 positive) cells (Figure 6). 5
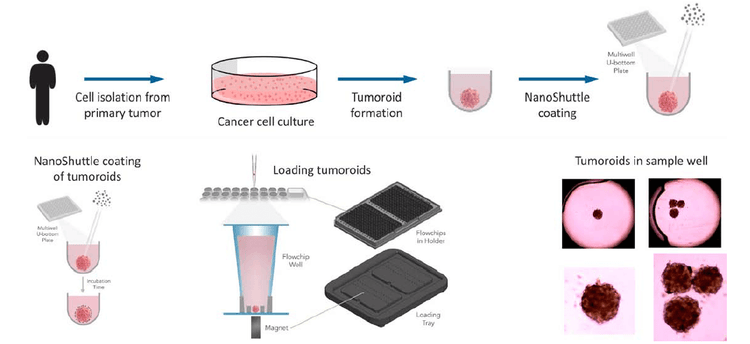
Figure 2. Top: Workflow for tumoroid formation. Bottom: Schematic of the protocol for magnetic labeling and positioning of tumoroids. Transmitted light images of tumoroids are shown on the Right. Tumoroids are centered in the wells with no optical artifacts from NanoShuttle particles.
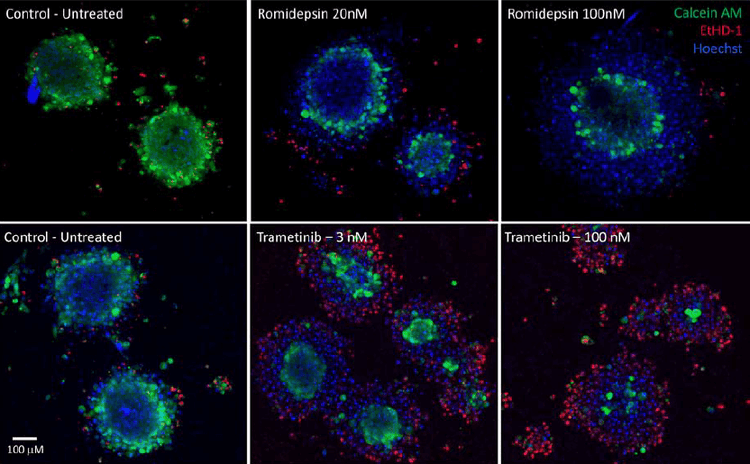
Figure 3. Images of tumoroids treated with romidepsin (Top) and trametinib (Bottom). Images are maximum projections of confocal stacks acquired with a 10X objective.
Microfluidic flowchip technology
Each Pu·MA System flowchip contains eight lanes of reagent wells connected by microfluidic channels. Four flowchips are placed in holder that locates all wells in a 384 multiwell plate format providing for 32 samples per assay. The compound wells in each lane hold media, compounds, or additional assay reagents. Tumoroids are placed into the sample well and located in a protected chamber at the bottom of the well. This allows reagents to be directed in and out of the sample well without disturbing or drying out the microtissue.
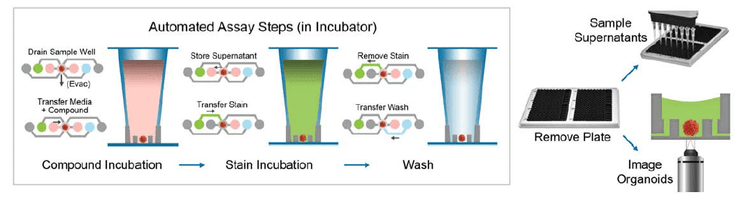
Figure 4. Protocol steps for Tumoroid assays.3 Tumoroids were treated overnight with compounds and then stained with viability dyes (1 μM calcein AM, 3 μM EthD-1, 33 μM Hoechst 33342) or FL-labeled primary antibodies to E-Cadherin and CD44 (BD Biosciences). Conditioned media can be removed for additional analyses.
Cancer disease modeling
- TU-BcX-4IC spheres were treated for 24 or 48 hours with three compounds from the NCI 60 panel of cancer therapeutics:
- Romidepsin – A histone deacetylase (HDAC) inhibitor
- Trametinib – Selective reversible allosteric inhibitor of MEK1 and MEK2 activity
- Paclitaxel – A mitotic inhibitor that interferes with microtubule growth
- Spheres were stained in a Pu·MA System with viability and cell surface biomarkers and imaged on ImageXpress Micro Confocal system (Figure 5). Image stacks were analyzed for percent Live (CD44 positive) cells (Figure 6).
- An insensitivity of the tumoroids to paclitaxel was measured consistent with the clinical presentation of the patient tumor.
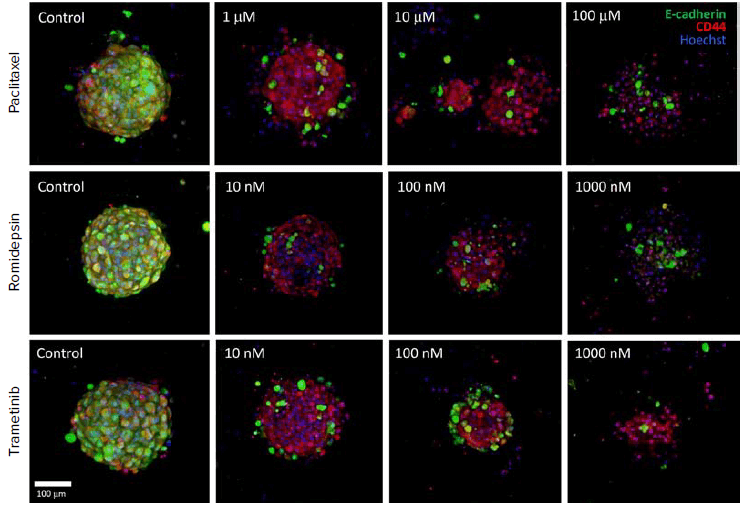
Figure 5. Tumoroids incubated with compounds for 24 hr and labeled for E-Cadherin (Green) and CD44 (Red). Images are maximum projection of confocal stacks taken with 20X water immersion (WI) objective. Treatments results in loss of E-Cadherin and disruption of organoids. EC50 values measured by percentage CD44 positive cells.
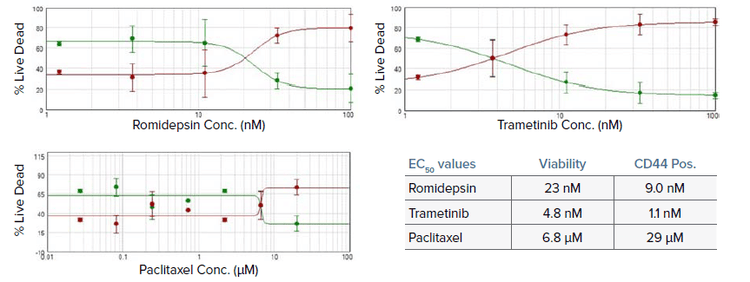
Figure 6. Concentration response curves from viability assays for tumoroids treated with romidepsin, trametinib, and paclitaxel. EC50 values are shown in table from both viability and CD44 staining. Values for romidepsin and trametinib were found to be within normal ranges while paclitaxel was significantly higher. This is consistent with the response of the patient’s tumor to treatment2.
Conclusion
- We have demonstrated capabilities of a novel semi-automated tumoroid assay system that performs complex protocols with 3D cell models in an incubator environment.
- Patient-derived tumoroids derived from primary tumors were assayed for compound response using high resolution confocal imaging of cell surface markers and viability stained for Live/Dead.
- The ability to analyze tumoroids and organoids in situ in order to capture toxicity information and perform functional assays shows great promise for disease modeling.
References
- Drug resistance profiling if a new triple negative breast cancer patient-derived xenograft model. Matossian, M.D. et al (2019) 19(1): 205, BMC Cancer
- In-depth characterization of a new patient-derived xenograft model for metaplastic breast carcinoma to identify viable biologic targets and patterns of matrix evolution within rare tumor types. Matossian, M.D. et al (2021) Clin. & Trans. Oncology (in revision)
- Disease modeling with 3D cell-based assays using a novel flowchip system and high-content imaging. Cromwell, E.F. et al (2021) 26(3): 237, SLAS Technol.
- Three-dimensional tissue culture based on magnetic cell levitation. Souza, G.R. et al (2010) 5(4): 291, Nat. Nanotechnol.
- High-Content Assays for Characterizing the Viability and Morphology of 3D Cancer Spheroid Cultures. Sirenko, O. et al (2015) 13, 402, Assay and Drug Dev. Tech.