
Application Note
Assessment of angiogenesis with automated time-lapse imaging
- Visualize angiogenic network formation over time with live cell, time-lapse imaging
- Conduct quantitative assessment of HUVEC cells throughout the various stages of angiogenesis with preconfigured analysis modules
- Generate multiple readouts to evaluate angiogenic networks including tube length and area, as well as numbers of branches, segments, and connected sets
Matthew Hammer | Applications Scientist | Molecular Devices
Jayne Hesley | Sr. Applications Scientist | Molecular Devices
Introduction
The formation of new blood vessels from existing ones, angiogenesis, is a critical physiological process involved in vertebrate development and wound healing. The process of angiogenesis is under strict homeostatic regulation, controlled by the actions of pro- and anti-angiogenic molecules. Disruptions in this homeostasis has been shown to play a role in various pathological conditions.1 Inadequacies in the angiogenesis process or in vessel preservation have been implicated in a variety of ischemic diseases such as myocardial infarction, as well as neurodegenerative diseases.4 Aberrant increases in vascular growth and abnormal vascular morphology are linked with many diseases such as cancer, chronic inflammation, and macular degeneration.1,3-5
Development of a variety of cell-based assays to study angiogenesis, as well as the effects of pro- and anti-angiogenic compounds, is critical for developing drugs to treat cancer, cardiac ischemia, and other disorders. Imaging methods are important to evaluate angiogenesis, and the use of robust and precise imaging systems and software to capture, analyze, and quantify this complex biology appropriately is vital.
We utilized a co-culture angiogenesis model containing normal human dermal fibroblasts and lentivirally-infected human umbilical vein endothelial cells (HUVEC) expressing GFP from Sartorius (IncuCyte® Angiogenesis 96-well PrimeKit) to demonstrate the utility of the ImageXpress® Pico Automated Cell Imaging System in the quantitative assessment of angiogenesis over time. Discontinuous live cell, time-lapse imaging was performed to assess the dose-dependent effects of pro- and anti-angiogenic compounds on HUVEC angiogenic tube formation over time. Automated image analysis was performed to generate multiple readouts for the evaluation of the intricate tube networks.
Materials
- IncuCyte Angiogenesis 96-well PrimeKit (Sartorius, cat. #4452) containing:
- Normal Human Dermal Fibroblast (NHDF) Cells
- Human Umbilical Vein Endothelial Cells expressing CytoLight Green (HUVEC CytoLight Green)
- Media supplements
- IncuCyte Angiogenesis PrimeKit VEGF/Suramin Supplement Kit (Sartorius, cat. #4437)
- 96-well flat, black wall, clear bottom microplate (Greiner, cat. #655090)
- Rapamycin (Thermo Fisher Scientific cat. #PHZ1235)
- ImageXpress Pico Automated Cell Imaging System and CellReporterXpress® Automated Image Acquisition and Analysis Software
Methods
Angiogenesis PrimeKit Assay
Normal human dermal fibroblasts and GFP-expressing normal human umbilical vein endothelial cells were provided in the Angiogenesis PrimeKit Normal human dermal fibroblasts (NHDFs) were thawed and reconstituted in seeding medium per the manufacturer’s protocol. Once reconstituted, cells were precipitated by centrifugation of the conical tube containing the NHDFs at 200 x g for four minutes. The supernatant was then removed, and the NHDF cell pellet was resuspended in 12 mL of complete seeding medium. 100 μL of this NHDF cell suspension was seeded into each well of a 96-well black wall, clear bottom microplate. The plate was incubated in the hood at room temperature for an hour to let the cells settle. GFP expressing human umbilical vein endothelial cells (GFP-HUVEC) were seeded at 100 μL per well on top of the NHDF layer. The plate was incubated in the hood for an additional hour to allow the HUVECs to settle. The plate was then placed into a 37°C incubator for an additional four hours prior to obtaining a day 0 read in the ImageXpress Pico system.
On the following day, the seeding media was removed from each well, and 150 μL of growth medium was added to the wells. The first compound addition was performed on day two, and subsequent compound additions were added on days four and seven. Compound solutions were prepared in warmed complete assay medium. Vascular endothelial growth factor, VEGF, was utilized to stimulate angiogenesis in the HUVEC cells. VEGF working solutions were made in a 1:4 dilution series in quadruplicate, starting from 16 ng/mL down to 0.25 ng/mL. To test the inhibitory effect of known anti-angiogenic compounds, either suramin or rapamycin was added to the wells in the presence of VEGF. 2X working solutions of suramin and rapamycin were added to the wells in combination with a 2X solution of VEGF. The angiogenesis inhibitor treatments were run in quadruplicate with a 1:4 dilution while the final concentration of VEGF was 4 ng/mL in each well. The final 1X concentrations for the inhibitors were 80 μM down to 1.25 μM for suramin, and 1.2 nM down to 0.018 nM for rapamycin.
Automated live cell imaging
Live cell imaging was performed using the ImageXpress Pico system with integrated environmental control for the maintenance and monitoring of 5% CO2, 20% O2, 85% humidity, and 37°C temperature. A discontinuous time-lapse acquisition was performed, where the plate was imaged in the ImageXpress Pico system and then placed back into the incubator until the next imaging time point. The first time point was acquired one hour post-plating. The second time point was captured 12 hours post-plating, and the third time point was captured 24 hours post-plating. The plate was then imaged once every 24 hours for the next nine days.
Nine sites per well were captured with the 10X objective in the brightfield and FITC channels, effectively imaging \~35% of each well. The images were stitched on-the-fly without manual configuration by utilizing the Stitched Acquisition Protocol. The FITC channel images were also acquired with on-the-fly 2D deconvolution, with an exposure time of 200 ms. The exposure time for the brightfield images was 10 ms.
Automated image analysis
The Angiogenesis Skeletonization analysis module, which is preconfigured in CellReporterXpress software, was utilized to identify and measure angiogenic network development. With minimal user input, the analysis module accurately segmented the HUVEC cells throughout division, growth, and tube formation. The analysis settings were optimized to identify long, thin objects that were at minimum 4 μm wide as tubes (Figures 1 and 2). This minimum width demarcation ensured that small cells, non-tube forming events, and debris were not picked up in the analysis. Large clumps of cells, indicative of HUVEC cell division and growth, were identified as nodes (Figure 1D). Moreover, quantitative measurements that effectively assessed the effects of pro- and anti-angiogenic compounds were generated, including mean and total tube length and area, tube length per set, number of nodes, segments, and branch points. Tube length per set measurements are presented in this application note to illustrate the effects of VEGF and antiangiogenic compounds on HUVEC cell tube formation (Figures 2 and 3).
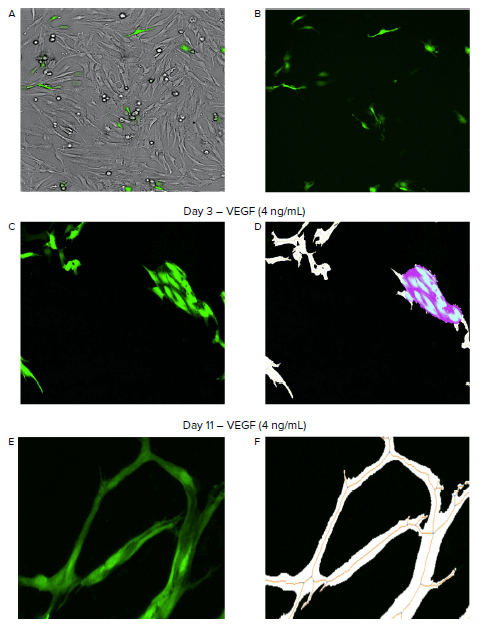
Figure 1. Automated imaging and analysis of angiogenesis with the ImageXpress Pico system. A–B. Images were taken in brightfield to visualize the co-culture of fibroblasts and HUVEC cells, while the FITC channel was utilized to image the GFP-expressing HUVECs (green). C–F. The Angiogenesis Skeletonization analysis module in CellReporterXpress software identified and measured tube network formation throughout the time-lapse experiment. The analysis module identified and measured angiogenic tubes (white), the tube network skeleton (orange), branch points (blue), and clumps of dividing and growing cells as nodes (purple) (D, F).
Results
Stimulation of angiogenesis with VEGF
The ability to monitor the effects of pro-angiogenic factors is critical for the development of drugs to combat ischemic diseases as well as for understanding the importance of angiogenesis in development and wound healing. Fundamental signaling molecules, including key growth factors, regulate blood vessel network development and patterning.2,3 Stimulation of angiogenesis with VEGF, known as a critical pro-angiogenic growth factor for endothelial cells, was performed in this live cell in vitro assay. The HUVEC cells demonstrated a baseline level of tube outgrowth and formation, and an immediate response was exhibited after the addition of VEGF. A marked spike in tube length occurred after the addition of growth factors on day 2, as well as after each subsequent addition (Figure 3). However, for the highest concentrations of VEGF, 16 ng/mL, the increase in tube length per set after the day 7 addition was negligible. Both 16 ng/mL and 4 ng/mL of VEGF exhibited maximum stimulation of tube network formation, while the two lowest concentrations exhibited a 60 percent and 40 percent stimulation, respectively.
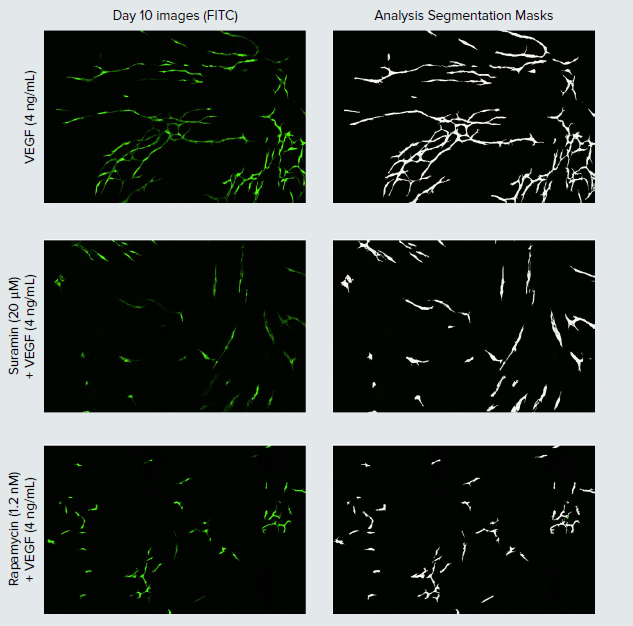
Figure 2. Stimulation and inhibition of angiogenic tube network development. Representative day 10 images (left) of HUVEC cells with corresponding image analysis segmentation masks of the tube networks (white) displayed (right). To test the effects of inhibitory compounds on VEGF stimulated network formation, suramin and rapamycin treatments were added in the presence of 4 ng/mL of VEGF on days two, four, and seven.
Inhibition of angiogenesis with suramin and rapamycin
Inhibition of angiogenesis has been the focus of therapeutic development for various diseases including a variety of cancers, inflammatory and degenerative diseases—with several anti-VEGF therapies currently on the market for the treatment of certain cancers and age-related macular degeneration to highlight a few.3 To show inhibition of VEGF-mediated angiogenesis, we tested various concentrations of two indirect inhibitors of angiogenesis, a general tyrosine kinase inhibitor, suramin, as well as an mTOR inhibitor, rapamycin, alongside the addition of 4 ng/mL of VEGF. Both suramin and rapamycin negatively impacted HUVEC tube formation, leading to shorter tube lengths as compared to the 4 ng/mL VEGF control (Figures 2 and 3). Inhibition of angiogenesis was clearly dose-dependent. The tested compound concentrations all prevented the HUVEC cells from reaching maximum stimulation, as seen by the smaller tube length per set values for the cells in these treatment groups in comparison to the 4 ng/mL VEGF control. Peak inhibitory effects were seen at the highest suramin concentration of 80 μM, which actually resulted in a net decrease in tube length over the time-lapse experiment.
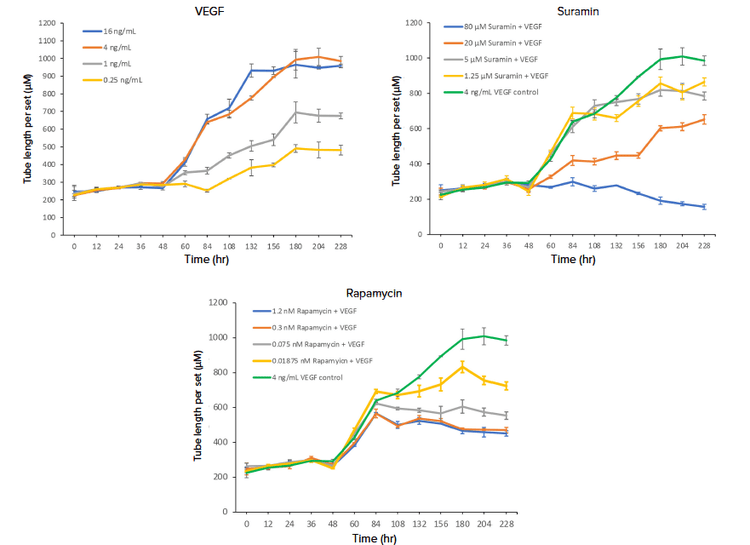
Figure 3. Measuring tube length for the assessment of angiogenic tube network formation. Tube length per set, which is the total tube length in microns divided by the number of connected sets, generated from the Angiogenesis Skeletonization analysis module in CellReporterXpress software was utilized to assess the effect of the increasing concentration of pro-angiogenic factor VEGF (A), as well as anti-angiogenic compounds suramin (B) and rapamycin (C). Suramin and rapamycin were added to the wells in the presence of 4 ng/mL of VEGF, and the effects of these compounds were compared to the 4 ng/mL VEGF control. Treatments at the varying concentrations were run in quadruplicate, and the data points for the replicates were averaged.
Conclusion
The clinical and biological significance of angiogenesis underscores the importance of in vitro cell-based assays for the study of this complex and dynamic process. The data presented here demonstrated the capability of the ImageXpress Pico system to accurately capture the effects of pro-angiogenic and inhibitory compounds while maintaining optimal live cell environmental conditions. Robust analysis methods enabled the characterization and quantification of angiogenic networks, which can be utilized to study the effects of novel therapeutics on angiogenesis.
References
- Li, Tinglu et al. “Tumor angiogenesis and anti-angiogenic gene therapy for cancer.” Oncology letters vol. 16,1 (2018): 687-702. doi:10.3892/ol.2018.8733
- Matsumoto, Ken, and Ema, Masatsugu. “Roles of VEGF-A signalling in development, regeneration, and tumours.” The Journal of
Biochemistry, Volume 156, Issue 1, July 2014, Pages 1–10, https://doi.org/10.1093/jb/mvu031 - Melincovici, Carmen Stanca et al. “Vascular endothelial growth factor (VEGF) – key factor in normal and pathological angiogenesis.”
Romanian journal of morphology and embryology = Revue roumaine de morphologie et embryologie vol. 59,2 (2018): 455–467. - Moriya, Junji, and Tohru Minamino. “Angiogenesis, Cancer, and Vascular Aging.” Frontiers in cardiovascular medicine vol. 4 65. 24
Oct. 2017, doi:10.3389/fcvm.2017.00065 - Nowak-Sliwinska, Patrycja et al. “Consensus guidelines for the use and interpretation of angiogenesis assays.” Angiogenesis
vol. 21,3 (2018): 425–532. doi:10.1007/s10456-018-9613-x