
Application Note
AI-assisted spike train synchronization analysis on human brain organoids
- AI-driven segmentation improves detection of neural somata in dense brain organoid, overcoming limitations of traditional calcium imaging analysis.
- By combining registration, segmentation, and signal extraction, the workflow ensures that calcium transients are reliably mapped back to the correct neuron and computation of reliable synchronization scores and raster plots.
- Combined morphological and activity-based analyses reveal functional distinctions, offering a tool for studying brain organoid behavior.
Zhisong Tong, Macha Prathyushakrishna, Oksana Sirenko | Molecular Devices, LLC
Introduction
Human brain organoids – three-dimensional neural tissues derived from human induced pluripotent stem cells, have emerged as powerful experimental systems for modeling early brain development and neuronal network formation in vitro. These self-organizing structures recapitulate key aspects of human cortical architecture, including the generation of excitatory and inhibitory neurons, the establishment of layered organization, and the progressive maturation of synaptic connectivity. As organoids mature, they begin to exhibit spontaneous calcium transients and electrophysiological oscillations that resemble early-stage neuronal network activity observed in the developing human brain.
A central hallmark of functional neural maturation is the emergence of coordinated firing patterns across neuronal populations. Synchronized spike trains reflect the establishment of synaptic coupling – features that are critical for understanding both normal neurodevelopment and disease-associated network dysfunction1. While E-phys (electrophysiology) offers superior temporal resolution for individual spikes, calcium imaging provides a better spatial, cell-type-specific view of networklevel activity2. However, extracting reliable spike timing information from organoid calcium imaging data presents significant challenges. Calcium signals are slower and noisier than electrophysiological recordings, and organoids contain densely packed, heterogeneous cell types whose activity overlaps in space and time. Recent advances in artificial intelligence provide new opportunities to overcome these analytical barriers. Deep learning–based segmentation enables more accurate identification of neuronal body (somata) and AI-assisted approaches allow researchers to quantify coordinated firing at a level of resolution previously difficult to achieve in organoid systems. Applying AI-assisted spike train synchronization analysis to human brain organoids thus provides a powerful framework for evaluating neural network development. This integration of stem cell–derived neurological models with advanced analysis tools stands to accelerate the study of human neurodevelopment and disease modeling.
Methods
Organoid culture and differentiation
Human dorsal forebrain organoids were generated from hiPSCs (ATCC ACS‑1023) using the STEMdiff™ Dorsal Forebrain Organoid Kit (Catalog #08620) following the manufacturer’s instructions. hiPSCs were maintained in mTeSR™ Plus, dissociated, and seeded at 3 × 10⁶ cells per well into AggreWell™800 plates in Seeding Medium with 10 μM ROCK inhibitor to support uniform aggregate formation (Day 0). During Days 0–6, organoids were cultured with daily partial medium changes using Neural Organoid Formation Medium. On Day 6, neural aggregates were moved to suspension culture in 6‑well plates and maintained in Neural Organoid Expansion Medium with full medium changes every 2 days until Day 25. From Days 25–43, organoids were cultured in Neural Organoid Differentiation Medium with medium changes every 2–3 days. After Day 43, they continued to receive medium changes every 2–3 days, and around Day 50 were transitioned to BrainPhys® medium to support neuronal activity. Functional assays were performed at later maturation stages (≥Day 75), when organoids exhibit clear spontaneous neuronal activity.
Calcium imaging (ImageXpress®)
Neuronal activity in brain organoids was measured by calcium imaging using the ImageXpress® Micro Confocal High-Content Imaging System with MetaXpress High- Content Image Acquisition and Analysis software. Organoids were incubated for 2 hours with 2X FLIPR® Calcium 6 Dye (Molecular Devices) on the day of imaging. Time‑lapse recordings were captured with a 20X confocal objective using ~250 ms exposures and 0.5‑second intervals for a total of 75 seconds, keeping the focal plane fixed from the initial frame. In this experiment, both synchronous and asynchronous organoids’ baselines were recorded, and they were treated with 4-aminopyridine (4‑AP, 0.08 μM, stimulation) following baseline imaging, and changes in oscillatory activity were recorded.
Image analysis
Image segmentation is a computational process that identifies and delineates the boundaries of biological objects. Here, cell segmentation was performed using the SINAP module in the IN Carta® Image Analysis Software. SINAP is a deep‑learning–based tool that includes several pre‑trained segmentation models and supports model retraining. To segment neurite bodies (somata), the Cellpose image analysis model, that is one of the available models within SINAP, was retrained using 10 training images that were generated using a pretrained Cellpose model and further refined with drawing tools and applied to calcium-channel images for the soma segmentation. Neurite outgrowths were segmented in the FITC (calcium dye) channel using the built-in Neurites Robust segmentation algorithm. Once segmentation was completed, morphology, intensity, spatial distribution, texture, and neurite features were extracted for both somata and neurites.
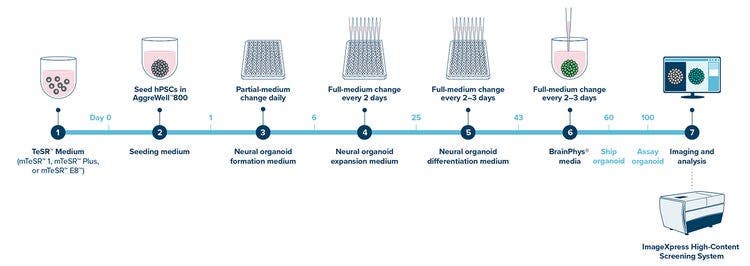
Figure 1.
To calculate the synchronization score of neuronal firing, image registration tool was applied to correct positional shifts of the plate in time-lapse images. Briefly, for images with noticeable shifts, the Track module in IN Carta Image Analysis Software was used to link masks corresponding to the same soma across different time points. A reference soma with stable intensity across all time points was selected to align and offset possible shifts of objects during time-lapse recordings for all somata. After shift correction, masks from different time points were grouped to individual soma based on the vicinity. The raster plot of neurons with firing activity was plotted and the synchronization score3 among different neurons was calculated.
Results
Trainable Cellpose model ensures accurate Soma segmentation
Cell segmentation is crucial for automatically identifying and outlining individual cells in images, enabling accurate cell counting, shape analysis, and tracking, which is vital for high-throughput biological research. Cellpose represents deep learning models trained on vast biological datasets4, allowing it to segment various cell types (neurons, immune cells, etc.) and tissues. While Cellpose is designed as a generalist model for various cell types, using it without retraining on specific datasets presents limitations, primarily a reduction in segmentation accuracy for images that are significantly different from its initial training data. SINAP module, an AI-powered deep learning tool within IN Carta Image Analysis Software (Figure 2A), provides a trainable Cellpose model to overcome the challenge (Cell.d option in the dropdown menu of model selection). In the current study, we used Cellpose model to segment the somata from calcium images. Figure 2B shows the result from the pretrained Cell.d model that segments cells with bright interiors and darker edges, as well as holes with dark interiors and bright edges, causing false positive detection (Figure 2B).
We thus retrained the Cellpose model with training images specific to somata in the calcium channel. A total of 10 training datasets were generated in the process of retraining the model. Associated with the model, the average diameter is set to 10 μm without reference wavelength. The resulting segmented soma masks are shown in Figure 2A and 2C, where the hole segmentation with dark interiors and bright edges are significantly suppressed.
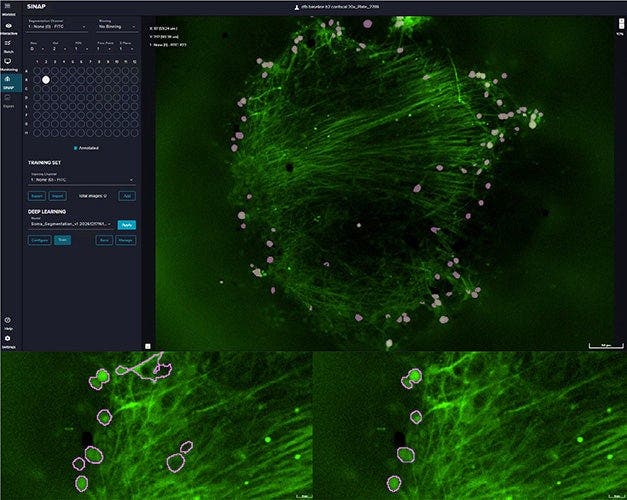
Figure 2. A. SINAP module interface within IN Carta Image Analysis Software. B. Cell body segmentation from pretrained Cellpose model. C. Cell body segmentation from retrained Cellpose model. (Magenta: Soma masks)
IN Carta Image Analysis Software track module helps image registration
Assigning somatic firing events back to the same neuron in calcium imaging data requires a multi-step pipeline that includes image registration, segmentation, and signal extraction. This process ensures that fluorescent transients (calcium events) are correctly mapped to specific, identified neurons over time. Image registration is essential for correcting plate‑motion artifacts in time‑lapse imaging, which result in unintended, non‑biological shifts of the sample – for example, movement of the plate when imaging starts before it has stabilized on the microscope stage.
Track module within IN Carta Image Analysis Software allows object tracking to track and follow objects over time. The consistent and similar path among multiple objects suggests an overall plate motion. A soma whose signal remained constant across all time points was selected for analysis (Figure 3A), and its displacements along the x- and y-axes are presented in Figure 3B and 3C. The selected cell body coordinates (Soma Center of Gravity X and Y) were then used to realign all cell bodies across the corresponding time points.
IN Carta Image Analysis Software allows single-channel soma and neurite detection
Soma and neurite segmentation are crucial in neuroscience for quantifying neuronal structure and development, enabling automated analysis of complex images to measure parameters like neurite length, branching, and overall morphology. However, neurite segmentation is difficult due to the high complexity of neuronal structure, low signal-to-noise ratios, and the immense, dense nature of brain imaging data.
IN Carta Image Analysis Software provides strong capabilities for segmentation of neurites and associated measurements like total neurite length per soma, number of neurite branch points per soma, neurite total intensity, etc. In this study, we applied Neurite Robust segmentation on the calcium images with minimum width set as 0.5 μm and maximum width set as 2 μm (Figure 4A). Figure 4B–C and Figure 4D present the segmentation masks of soma and neurites derived from a synchronous brain organoid and an asynchronous brain organoid, respectively. Segmentation of the synchronous brain organoid with the emergence of functional neuronal networks and maturation/crosslinking clearly reveals longer neurite outgrowth compared to the asynchronous organoid with calcium transients localized to individual cells or small clusters.
The IN Carta Image Analysis Software chart dashboard displays charts and heatmaps for the data of interest. Selected features are presented in Figure 5. For the synchronous brain organoid, the total neurite intensity was quantified for both the baseline and stimulation conditions (Figure 5A, 5B). A clear pattern of synchronous firing merged, and the stimulated organoid exhibited a noticeably faster oscillation with 21 within the acquisition period versus 12 for the baseline.
For the asynchronous brain organoid, no clear firing pattern was detected (data not shown). However, the standard deviation calculated across all somata based on each soma’s mean intensity displayed a fluctuating up-and-down pattern under both baseline and stimulation conditions (Figure 5C, 5D), suggesting that neuronal intensity variations may still follow an underlying pattern.
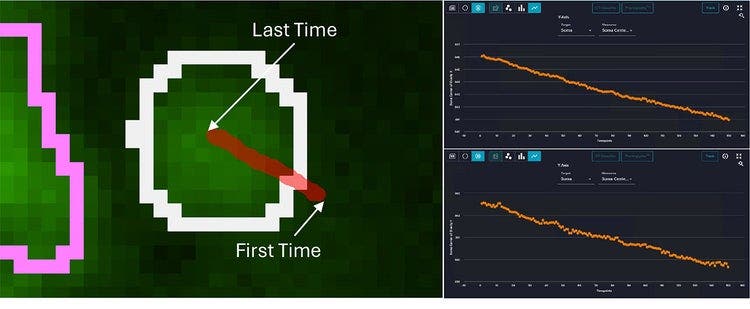
Figure 3. A. The moving trajectory of the cell body with stable intensity across time points; B. The shift in x of the same cell body as 3A; B. The shift in y of the same cell body as 3A.
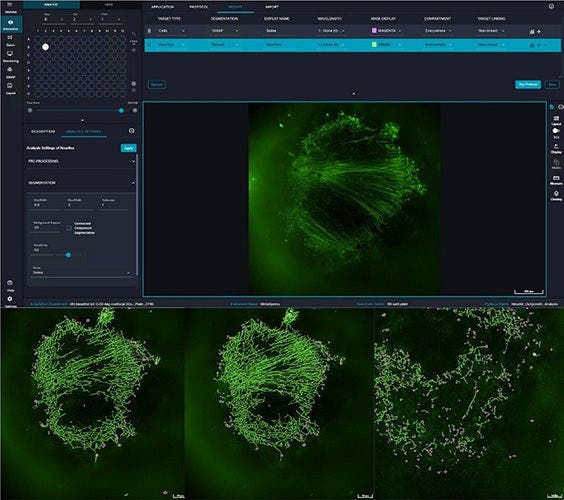
Figure 4. A. IN Carta software Flexi-Protocol 2D interface of setting up Soma and Neurites segmentation; B–C. Segmentation of synchronous brain organoid at different time points; D. Segmentation of asynchronous brain organoid. (Magenta: Soma, Green: Neurite)
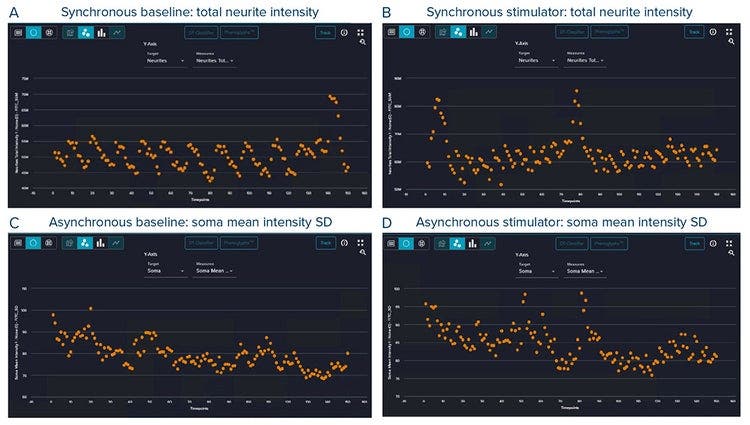
Figure 5. A–B. The chart represents a dashboard of total neurite intensity on synchronous organoid without stimulation (A) or after stimulation (B). C–D. The chart represents a dashboard of soma mean intensity (mean intensity of all pixels of individual soma) standard deviation (SD, across all somata) from organoid with asynchronous activity, without stimulation (C), or after stimulation (D). Please note X axis represents time points for each chart.
IN Carta Image Analysis Software generates features that facilitate synchronization scores and raster plots
Features associated with cell segmentation are crucial because accurate identification of individual cell boundaries enables the extraction of vital quantitative data (count, size, shape, intensity, location) for analyzing cell states, interactions and dynamics, with deep learning models now essential for handling complex, dense biological images and improving throughput. IN Carta Image Analysis Software generates various kinds of measurements ranging from common features like Morphology, Intensity, Spatial, Texture to specialized features like Neurite, Fiber and Tracking.
In this study, we used spatial information – specifically, the Center of Gravity X and Center of Gravity Y – to correct plate motion artifacts (as described in the previous section) and to assign events to their corresponding neurons (see Figure 6 for examples). Figures 7A and 7C present the synchronization score3 over time for the synchronous brain organoids without and with stimulation, respectively. Notably, peaks in the synchronization score align with the intensity profiles shown in Figures 5A and 5B. With stimulation, the synchronous brain organoid exhibited a rise in the overall spike synchronization score3 from 0.2581 to 0.3938, which indicates that the neural firing has become significantly more synchronized (an increase of 56%). Here the score measures the similarity between spike trains based on the number of coincident spikes. A value of 0 indicates no coincidence, while 1 indicates perfect synchronization.
Next, we used intensity information, soma mean intensity to generate the raster plot of neuron firing activity shown in Figure 7B and 7D. Manual counting identified 12 oscillations during baseline mode (Figure 7B) and 21 during stimulation mode (Figure 7D), aligned with the total neurite intensity profiles presented in Figure 5A and 5B.
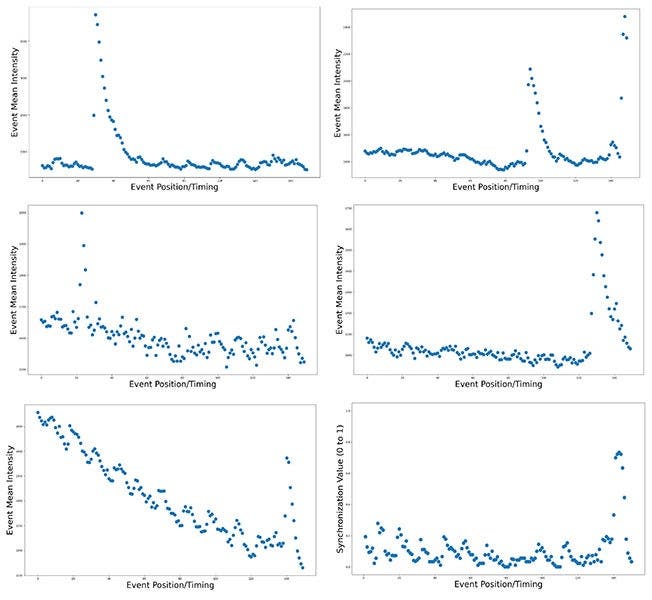
Figure 6. Selected examples of neuron firing events. The blue dots show the mean intensities from a single neuron across all time points.
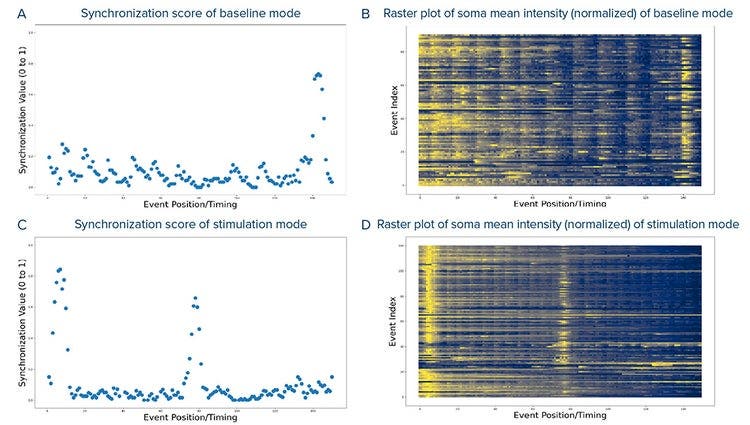
Figure 7. A. Synchronization score of synchronous brain organoid without stimulation; B. Raster plot of synchronous brain organoid without stimulation; C. Synchronization score of synchronous brain organoid with stimulation (normalized to (0, 1)); D. Raster plot of synchronous brain organoid with stimulation (normalized to (0, 1)).
Conclusions
Here, we present a robust framework for evaluating functional neuronal activity using calcium imaging. By integrating retrainable Cellpose segmentation, image registration, and feature based analysis, IN Carta Image Analysis Software enabled accurate identification and tracking of neuronal soma and neurites in calcium imaging data. Retraining the Cellpose model eliminated false positives and produced reliable soma masks, while the Track module effectively identified overall plate motion. Robust neurite segmentation further revealed structural differences between synchronous and asynchronous brain organoids. Combining spatial and intensity features allowed computation of synchronization scores and raster plots, demonstrating clear coordinated firing in synchronous organoids – especially under stimulation – while asynchronous organoids lacked such synchronized behavior. Overall, the workflow provides a dependable framework for structural and functional analysis of neuronal activity in brain organoids.
References
- Kobayashi, R., Kurita, S., Kurth, A. et al. Reconstructing neuronal circuitry from parallel spike trains. Nat Commun 10, 4468 (2019).
- Wei Z, Lin B-J, Chen T-W, et al. A comparison of neuronal population dynamics measured with calcium imaging and electrophysiology. PLOS Comput. Biol 16, e1008198 (2020).
- Kreuz T, Mulansky M and Bozanic N, SPIKY: A graphical user interface for monitoring spike train synchrony, J Neurophysiol 113, 3432 (2015)
- Stringer, C., Wang, T., Michaelos, M. et al. Cellpose: a generalist algorithm for cellular segmentation. Nat Methods 18, 100–106 (2021).