
Application Note
Technothrombin TGA Thrombin Generation Assay on the SpectraMax i3x Multi-Mode Microplate Reader
- Get consistent results with standardized reagents
- Save time by running only one calibration curve per substrate lot
- Run assays easily with a fluorescence microplate reader
Lieselotte Wagner, PhD, Product Manager | Richa Amiya, PhD, Product Manager | Technoclone Herstellung von Diagnostika und Arzneimitteln GmbH
Cathy Olsen, PhD, Senior Application Scientist | Cathleen Salomo, PhD*, Product Manager | Teresa Castano Martinez, PhD*, Field Application Scientist | Molecular Devices
Introduction
This application note describes the successful application of the Technothrombin® Thrombin Generation Assay (TGA) using the SpectraMax® i3x Multi-Mode Microplate Reader. Assessing the generation of thrombin in plasma samples allows a better understanding of coagulation mechanisms, as well as abnormalities in these mechanisms associated with chronic diseases like thrombophilia or hemophilia. Technothrombin TGA enables monitoring of the effect of coagulation-directed drugs for the treatment of thrombophilia or hemophilia and can be used to evaluate the thrombogenic activity of immunoglobulin concentrates.
To accommodate researchers’ need to determine time-dependent changes in thrombin concentrations on a flexible platform, Technoclone GmbH has developed a plate reader-compatible assay format. The Technothrombin TGA assay is based on monitoring the fluorescence generated by the cleavage of a fluorogenic substrate by thrombin over time. Cleavage occurs upon activation of the coagulation cascade by different triggers (tissue factor and phospholipids) at different concentrations. From the changes in fluorescence over time, the nanomolar concentration of thrombin in the sample can be calculated from a thrombin calibration curve. Monitoring the increase in thrombin concentration with time allows one to calculate the amount of thrombin generated in the sample. In addition, thrombin values vs. time can be plotted for the whole coagulation process, resulting in a visualization of the different phases of thrombin generation.
The Technothrombin TGA assay can be run with different triggers of the coagulation cascade, and the selection of the correct trigger reagent is important since it will allow one to study different coagulation mechanisms. The triggers differ in the composition of phospholipids and/or tissue factor, resulting in different activating capacities that inform on different components of the coagulation system. The different TGA trigger reagents, with the corresponding tissue factor and phospholipid concentrations and areas of investigation for which they may be used, are shown in Table 1.
For further information and details regarding the different triggers and when to use them, please contact Technoclone GmbH: www.technoclone.com.
All three triggers were tested on the SpectraMax i3x reader, with the best performance observed when using a fluorescence detection cartridge. Most of the data shown in this application note are for Technothrombin TGA RB Trigger, as this is representative for data processing and assay functionality.
Materials
- SpectraMax i3x Multi-Mode Microplate Reader (Molecular Devices) with FI-COFL detection cartridge (Molecular Devices, P/N 0200-7002)
- Immuno Standard Modules, black MaxiSorp (Thermo Fisher Scientific, P/N 475515)
- Technothrombin TGA reagents from Technoclone GmbH:
- 5006010 Technothrombin TGA Kit including three different triggers, Calibrator, and Control sample
- The following are individual reagents that can be ordered separately:
- 5006209 Technothrombin TGA RB 5 x 0.5 mL
- 5006210 Technothrombin TGA RB 50 x 0.5 mL
- 5006212 Technothrombin TGA RC Low 5 x 0.5 mL
- 5006213 Technothrombin TGA RC Low 50 x 0.5 mL
- 5006214 Technothrombin TGA RC High 5 x 0.5 mL
- 5006216 Technothrombin TGA RC High 50 x 0.5 mL
- 5006230 Technothrombin TGA SUB 50 x 1.5 mL
- 5006235 Technothrombin TGA SUB 5 x 1.5 mL
- 5006320 Technothrombin TGA Control high 5 x 1 mL
- 5006330 Technothrombin TGA Control low 5 x 1 mL
- 5006345 Technothrombin TGA CAL Set
Methods
Data acquisition
A SoftMax® Pro Software data acquisition protocol was configured using guidelines provided by Technoclone GmbH. A preconfigured protocol is available on Spectranet, Molecular Devices’ customer care portal. The instrument settings for the SpectraMax i3x reader are summarized in Table 2. The Fluorescence Intensity (FI) (coumarinfluorescein) detection cartridge was used for this assay for best sensitivity, but the onboard monochromatorbased fluorescence detection may also be used. Other instruments suitable for this assay include SpectraMax Mini, SpectraMax iD3s, and SpectraMax iD5e readers. The SpectraMax i3x reader’s temperature was set to 37°C twenty minutes prior to the read.
Phospholipid concentration
- Detecting hypercoagulability and bleeding tendency
- Monitoring FVIII inhibitor bypass therapy with rFVIIa and FEIBA hF VII, hF Xa, hF XIa
- Finding correlation of thrombin generation results with thrombotic events
- Measuring the thrombophilic capacity
- Monitoring the thrombogenicity of microparticles
- Monitoring the anticoagulant therapy with heparin, heparinoids, or direct oral anticoagulant (DOACS)
Table 1. Characteristics of and uses for the different TGA trigger reagents
For the measurement of this assay, two independent plates were prepared: the calibration curve plate and the sample plate. First, the thrombin calibration curve was prepared with calibrator concentrations ranging from 3.6 nM to 361 nM thrombin. The concentration range from the thrombin calibration curve is batch dependent and will be indicated on the vial’s label. 40 μL of each calibration dilution was pipetted into duplicate assay wells. Immediately, 50 μL of the fluorogenic substrate was added, the plate was transferred to the plate reader, and a kinetic read was performed, with data collected at 30-second intervals for 10 minutes.
For the sample plate, 40 µL of sample was added to the wells first, followed by 10 µL of the corresponding trigger and 50 µL of the fluorogenic substrate, and then a kinetic read was performed, with data collected at 1-minute intervals for one hour.
EM 465 nm (35 nm bandpass)
Table 2. Plate Reader settings for thrombin calibration curve and sample plate.
Data analysis
After data were generated using the SpectraMax i3x reader, the raw data were exported from SoftMax Pro software to Excel. Data evaluation was performed in the Technothrombin TGA evaluation file, which can be downloaded from www.technoclone.com (Figure 1); this uses an optimized algorithm to correct for the inner filter effect.
The raw data obtained from the thrombin calibration curve measurement were used from time point 30 seconds. The same calibration curve can be used for all further sample measurements using the same lot of Technothrombin TGA substrate. The raw data obtained from the sample measurements were copied into the same evaluation file for analysis.
Read from Top
Read Height: 0.8 mm*
linear, medium
*Read height should be optimized for each assay volume used.
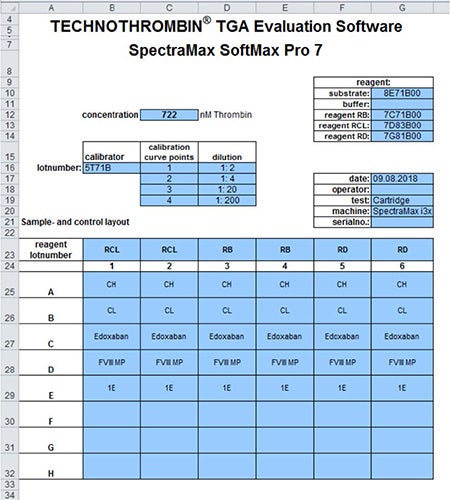
Figure 1. Layout with all information used for sample measurement: reagent lots, calibrator, operator, instrument, and plate layout.
Results
The raw data of the thrombin calibrators were plotted in SoftMax Pro software (Figure 2) for data visualization. For further data analysis, the Technothrombin TGA evaluation file was used. The increase of the signal of the cleaved fluorogenic substrate relates to the thrombin concentration. For each calibrator, signal was calculated as RFU/min and was used to generate the calibration curve using the Technothrombin TGA evaluation file (Figure 3). This calibration curve was used to convert ∆RFU of sample measurement to thrombin concentration (nM).
The raw kinetic profiles of the sample measurement in SoftMax Pro software are shown in Figure 4. These data were transferred to the Technothrombin TGA evaluation file for analysis and plotting of a thrombin generation curve. First, an optimized algorithm calculated the first derivative of sample raw data. Then the calibration curve was used to convert ∆RFU of sample measurement to thrombin concentration (nM). The thrombin generation curve (Figure 5) was used to calculate all thrombin generation parameters: lag time, time to peak, nM peak thrombin, velocity-index, and area under the curve (AUC). In general, the TGA curve shows the variation of the thrombin concentration during the activation of the coagulation cascade.
The obtained thrombin generation curve for samples activated with Technothrombin TGA RB trigger are shown in Figure 6. The thrombin generation parameters and the thrombin generation curves reflect the thrombogenic potential of each sample. Results from a normal plasma sample, a sample from a patient with thrombophilia, and a sample from a patient with hemophilia A are shown in Table 3. Parameters, such as peak of thrombin, AUC and velocity index of the thrombophilia patient sample are increased in comparison to those of the normal sample, indicating its high thrombogenic potential. In contrast, the same parameters of the hemophilia A patient sample are reduced in comparison to those of the normal sample, reflecting the clotting deficiency of these patient groups, which is caused by a missing or defective factor VIII.
Using standardized Technothrombin TGA reagents, and a validated SoftMax Pro software protocol on a SpectraMax i3x reader, a precise measurement with CVs < 10% is possible, as shown in Tables 4 and 5. In this case, Technothrombin TGA RC Low was chosen as an example, this trigger being mostly used for thrombophilic patient samples.
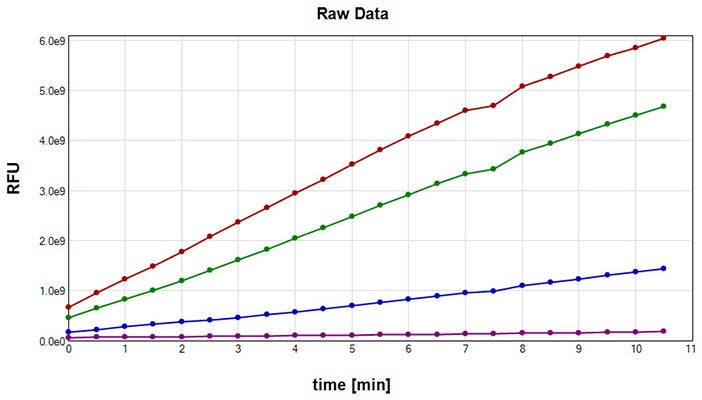
Figure 2. Thrombin calibrators, raw data shown using SoftMax Pro software.
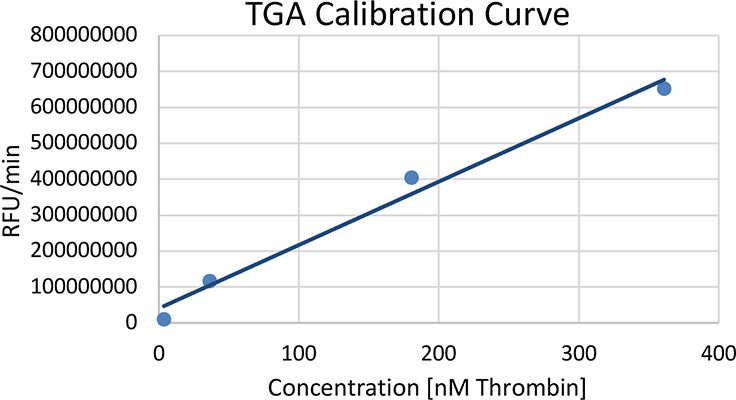
Figure 3. Thrombin calibration curve plotted in the Technothrombin TGA evaluation file.
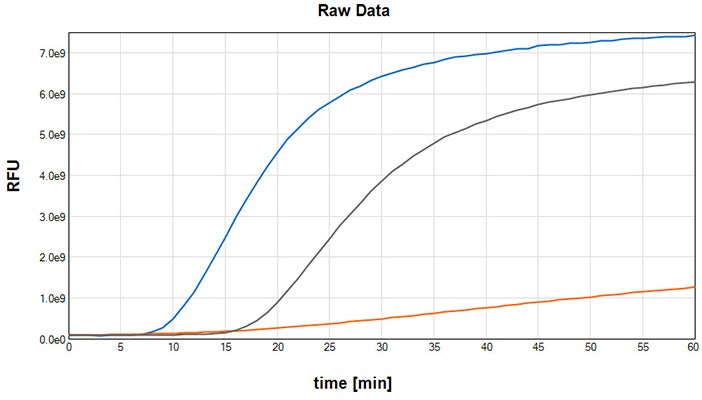
Figure 4. Kinetic traces in SoftMax Pro software for samples triggered with Technothrombin TGA RB.
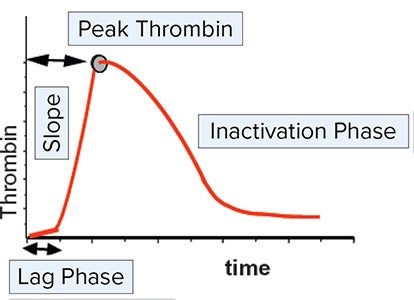
Figure 5. TGA curve and phases of clot formation. Lag Phase – phase from the time point when the TGA trigger reagent including CaCl2 is added until the first burst in thrombin formation. Peak Height where two different parameters are calculated: Peak Thrombin – maximal concentration of thrombin generated, and Time to Peak – time at the highest concentration of generated thrombin (peak of Thrombin). Slope – steepest rate of thrombin formation per minute, calculated by the evaluation file as velocity index. AUC – area under the curve representing the endogenous thrombin potential.
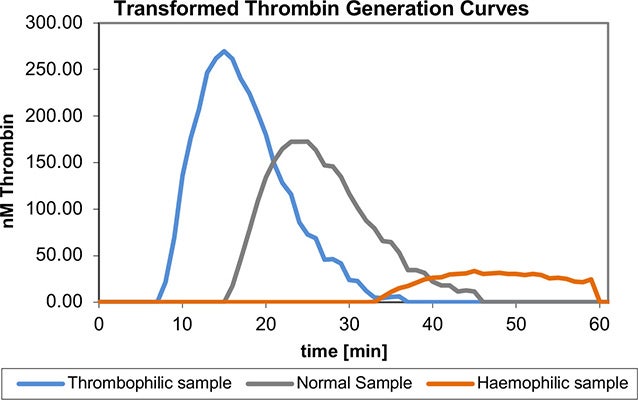
Figure 6. Transformed thrombin generation curves of a normal plasma sample, a sample from a thrombophilia patient, and a sample from a hemophilia A patient, all samples triggered with Technothrombin TGA RB. Curves were plotted using the Technothrombin TGA evaluation file.
(Velocity-Index)
Table 3. Results of a normal plasma sample, a thrombophilia patient sample, and a hemophilia A patient sample; data were analyzed using the Technothrombin TGA evaluation file.
Table 4. Intra-assay %CVs for TGA parameters
Table 5. Inter-assay %CVs for TGA parameters
Conclusion
The SpectraMax i3x reader, together with SoftMax Pro Software and the Technothrombin TGA evaluation file, offers an ideal platform to perform thrombin generation assays with excellent precision using the Technothrombin TGA reagents kit or modular TGA reagents as per user requirement. With validated reader settings, standardized reagents, and tools for complete assay analysis, this platform meets the needs of researchers in the fields of thrombophilia, hemophilia, anticoagulation, microparticle thrombogenicity, and related drug development, who are now enabled to make accurate thrombin generation measurements that are critical to their success.