
Application Note
Sensitive quantitation of plasmid DNA from bacteria cultured in microplates
- Sensitive fluorescent quantitation of DNA down to 50 pg/mL, suitable for plasmid preps from bacteria grown in microplates
- Linear dynamic range spanning over four orders of magnitude
- Easy analysis of results with ready-to-use protocols in SoftMax® Pro Software
Sushmita Sudarshan, PhD | Application Scientist, Assay Development | Molecular Devices
Cathy Olsen, PhD | Senior Application Scientist | Molecular Devices
Introduction
DNA purification and quantitation are among the most common applications performed in scientific laboratories. From cloning and PCR to transfection and sequencing, plasmid DNA preps and their subsequent quantification are critical to the success of workflows across a vast range of scientific fields.
In this application note we illustrate a versatile method of plasmid DNA purification that can be used with relatively small volumes of bacterial culture, such as those grown in a 96-well microplate format. The concentrations of DNA preps produced by this assay are easily assessed using a sensitive fluorescent assay read on a SpectraMax® iD3s Multi-Mode Microplate Reader.
Materials
- Quant-iT™ PicoGreen™ dsDNA Assay Kit (Thermo Fisher Scientific cat. #P7589)
- 96-well solid black microplate (Greiner Bio-One cat. #655076)
- pGEM®-T Vector Systems with JM109 Competent Cells (Promega cat. #A3610)
- Mag-Bind® Ultra-Pure Plasmid DNA 96 Kit (Omega Bio-tek cat. #M1258-01)
- SpectraMax iD3s Multi-Mode Microplate Reader (Molecular Devices)
Note: The SpectraMax iD5e Multi-Mode Microplate Reader also features fluorescence detection and yields equivalent results for the PicoGreen assay.
Methods
Bacterial culture preparation and cell harvest
Escherichia coli harboring the target plasmid (JM109 strain transformed with pGemT vector + control insert) was cultured overnight in a 96-well plate containing LB broth supplemented with 25 μg/mL ampicillin at 37 °C. Growth of cultures was monitored for 18 hours in a SpectraMax iD3s Multi-Mode Microplate Reader, with absorbance measurements made every 15 minutes and continuous shaking between reads1. Following incubation, 20 samples (200 μL each) of the bacterial cultures were transferred to microcentrifuge tubes and pelleted by centrifugation at 6000 RCF (Eppendorf Minispin Plus Microcentrifuge) for 1 minute. The supernatants were discarded, and plasmid DNA was extracted using the Mag-Bind UltraPure Plasmid DNA kit according to the manufacturer’s product manual.
Plasmid DNA extraction steps
- Bacterial pellets were fully resuspended in the provided resuspension buffer (containing RNase A) by pipetting up and down until no clumps remained.
- Lysis buffer was added, and the tubes were gently inverted 6–8 times to mix. Lysates were incubated briefly at room temperature until they became clear and viscous.
- Neutralization buffer was added, and the tubes were inverted immediately and thoroughly to precipitate cell debris and genomic DNA.
- Lysates were clarified by centrifugation as described above, and the supernatants were transferred to a 96 deep-well plate.
- Mag-Bind paramagnetic beads and binding buffer were added to the cleared lysates.
- The mixtures were gently mixed by pipetting to allow plasmid DNA to bind to the bead surface.
- The 96 deep-well plate was placed on a magnetic separation rack until the solution cleared, and the supernatants were discarded without disturbing the beads.
- Beads were washed sequentially with the provided wash buffers to remove salts, proteins, and other contaminants.
- After the final wash, beads were air dried briefly on the magnetic rack to remove residual ethanol.
- Plasmid DNA was eluted from the beads using low salt elution buffer. 100-μL eluates were collected into a fresh 96-well plate after magnetic separation.
Quant-iT PicoGreen dsDNA Assay
The method for this assay follows the instructions in the Quant-iT PicoGreen dsDNA Reagent and Kit User Guide, with a 200 μL assay volume to fit the 96-well microplate format.
- 1X TE buffer (10 mM Tris-HCl, 1 mM EDTA, pH 7.5) was prepared by diluting the concentrated buffer supplied with the kit 20-fold with DNase-free water.
- An aqueous working solution of Quant-iT PicoGreen reagent was prepared by making a 200-fold dilution of the concentrated DMSO solution in 1X TE buffer (prepared above). This solution was used within a few hours of its preparation.
- For the DNA standard curve, a 2 μg/mL stock solution of the lambda DNA standard provided with the kit was prepared by diluting it 50-fold in TE.
- For this application note, a series of standards ranging from 50 pg/mL to 1000 ng/mL was set up in a 1:3 dilution series.
- Standards were pipetted into a solid black 96-well microplate (assay plate) at 100 μL per well, in triplicate. A set of buffer blank wells containing TE only (no DNA) was included.
- Plasmid DNA samples from above were diluted 1:20 in TE, then 100 μL of diluted sample was pipetted into duplicate wells of the assay plate.
- 100 μL of the aqueous working solution of Quant-iT PicoGreen reagent was added to each assay well. The plate was then mixed briefly using a plate shaker and incubated for 2 to 5 minutes at room temperature, protected from light.
Results
A ready-to-use assay protocol available in the Protocol Library of SoftMax Pro software was employed to generate data on a SpectraMax iD3s reader with excitation wavelength of 490 nm and emission of 530 nm. PMT Gain was set to Automatic, with an integration time of 400 ms. Optimized settings for the PicoGreen assay are included in the protocol. The microplate was read from the top using the optimal read height of 2.37 mm, which was determined using the Read Height Optimization feature of the software.
The Template Editor in the assay protocol, which includes pre-set groups, was used to designate wells as standard or sample, after which DNA concentrations, as well as replicate standard deviation and %CV, were automatically calculated. A sample dilution factor of 20 was applied to arrive at the final DNA concentration for each sample.
Plasmid DNA prep concentrations were readily quantitated from the DNA standard curve, set up as described (see Figure 1). Concentrations of the preps ranged from 134.8 ng/mL to 993.8 ng/mL (see Table 1), calculated from sample RFU values, all of which fell within the range covered by the DNA standards.
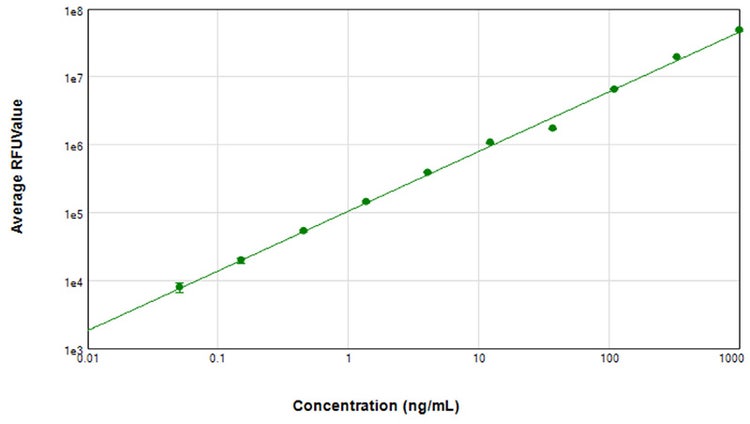
Figure 1. DNA standard curve, with standard concentrations ranging from 50 pg/mL to 1000 ng/mL (r2 = 0.998). From this standard curve, concentrations of plasmid DNA prep samples were interpolated.
Table 1. Plasmid prep sample DNA concentrations. A group table in SoftMax Pro software displays sample IDs, RFU values, and calculated concentrations, including replicate statistics and final adjusted concentrations.
Conclusion
The ease of the PicoGreen DNA quantitation assay, from reagent preparation to assay setup, is well complemented by the efficiency of data generation using SoftMax Pro software. Accurate calculation of concentrations from a standard curve, along with a clear display of the results and their precision, are achieved using an available protocol that can be readily adapted to a user’s specific assay setup. The sensitivity of the assay in combination with the SpectraMax iD3s reader enables accurate quantitation of plasmid preps from small-volume cultures grown in a microplate.
References
- Monitor effects of nutrient or antibiotic addition on bacterial growth. Molecular Devices application note 2827A (2025).
- Sensitive fluorescent quantitation of DNA with the Quant-iT PicoGreen dsDNA Assay Kit. Molecular Devices application note 2373B (2022).