
Application Note
Monitor effects of nutrient or antibiotic addition on bacterial growth
- Advanced shake settings let you dial in your microbe’s optimal growth conditions
- Onboard injectors enable reagent addition with continuous generation of growth data
- Workflow editor allows setup of complex workflows
Cathy Olsen, PhD | Sr. Application Scientist | Molecular Devices
Sushmita Sudarshan, PhD | Application Scientist, Assay Development | Molecular Devices
Introduction
Insights into microbial growth can be gained by measuring the wavelength-specific absorbance of light by cultures over time. Bacterial growth curves performed in 96-well microplates using a microplate reader allow one to monitor many different experimental conditions at once, with onboard injectors offering a convenient way to make experimental additions whose effects on growth can be quantified in real time.
Here we show how the SpectraMax® iD3s Multi-Mode Microplate Reader with Advanced Shake and dual injectors was used to continuously measure the growth of E. coli cultures for 15 hours. In between absorbance reads, the plate was shaken to ensure aeration and nutrient availability. At a selected time point, glucose or chloramphenicol was added to a subset of wells via injectors, with the results on growth observed as kinetic traces displayed in SoftMax® Pro Software.
Materials
- E. coli, strain JM109
- Growth media, LB Broth (1X) (Thermo Fisher Scientific cat. #10855001)
- Glucose, 1 M stock (Fluka BioChemika cat. #49158)
- Chloramphenicol, 10 mg/mL in ethanol (Thermo Fisher Scientific cat. #J67273.AB).
This stock solution was further diluted to 500 ug/mL prior to use. - Clear 96-well microplate (Corning cat. #3599) • QPix® FLEX™ Microbial Colony Picker (Molecular Devices)
- SpectraMax® iD3s Multi-Mode Microplate Reader (Molecular Devices) with:
- SoftMax® Pro Software
- Advanced Shake (optional feature)
- Injector system with SmartInject® Technology
Note: The SpectraMax iD5e Multi-Mode Microplate Reader also offers Advanced Shake and SmartInject technology and can be used for similar bacterial growth applications.
E. coli culture and generation of growth curves
E. coli strain JM109 was streaked onto LB agar plates using the QPix FLEX Microbial Colony Picker. A single colony was subsequently inoculated into 5 mL of LB broth and grown in a 15-mL culture tube with shaking for 14 to 16 hours at 37°C, until reaching an optical density at 600 nm (OD₆₀₀) of approximately 0.9 OD. The overnight culture was then diluted with fresh LB broth to an OD₆₀₀ of about 0.1 OD for the experiments. 190 μL of this E. coli culture was then transferred to each well B2 to G11 of a clear 96-well microplate, and LB broth was added to the wells along the outer edges of the microplate to minimize evaporation of the inner wells. To wells in columns 4 and 5, glucose was added to a final concentration of 30 mM. The microplate was then placed in the SpectraMax iD3s reader, and a kinetic read was initiated using a protocol with workflow set up in SoftMax Pro software as described below (see also Figure 1). Injections of glucose, a nutrient, or chloramphenicol, a broad-spectrum antibiotic that inhibits bacterial protein synthesis, into replicate wells were set up to occur when cultures were in the mid-log phase of growth.
Workflow steps
- Run 14 cycles, 3.3 hours total, consisting of the following steps:
- Read absorbance at 600 nm (OD600)
- Shake for 870 seconds in orbital mode with diameter 2.5 mm and speed 500 rpm (settings selected to match those of a lab shaker)
- Repeat from step (a)
- After 14 cycles are complete, inject 6 μL glucose stock into wells of columns 6 and 7 (final concentration 30 mM)
- Inject 3 μL chloramphenicol stock into wells of columns 8 and 9 (final concentration 7.7 μg/mL)
- Inject 15 μL chloramphenicol stock into wells of columns 10 and 11 (final concentration 36.6 μg/mL)
- Run 57 cycles, 14 hours total, consisting of the following steps:
- Read absorbance at 600 nm
- Shake for 870 seconds in orbital mode with diameter 2.5 mm and speed 500 rpm
- Repeat from step (a)

Figure 1. Workflow Editor in SoftMax Pro software. This feature was used to set up a kinetic plate read with injections of glucose and antibiotic at specified volumes, into designated wells, performed at a selected time.
Results
Raw data on bacterial growth from the initial plating, through lag phase and log phase, and responses to the addition of glucose or chloramphenicol, were generated using SoftMax Pro software and could be viewed as continuous kinetic traces at any time during the workflow (Figure 2).
The entire workflow was set to run for 17 hours and 16 minutes, plus about 1 minute required for the three injections. However, since the workflow run can be canceled at any time without any loss of data generated thus far, in the case described here it was stopped during cycle 46 of step 5 above, at about 15 hours, at which time clear differences were already observed among the various experimental treatments.
For each growth condition tested, formulas were applied to the raw data using the Data Reduction feature in SoftMax Pro software to calculate maximum OD600 reached during the growth period, as well as time at which maximum OD600 was reached for each well of the microplate. In control wells, growth of E. coli exhibited a lag phase, followed by a log phase, reaching a maximum OD600 of 1.19 at 12.6 hours (Figure 3A). Cultures to which glucose was added just prior to starting the kinetic read showed a dimorphic (two-phase) growth curve, reaching a maximum OD600 of 1.27 at 14.3 hours (Figure 3B). When glucose was injected into cultures during mid-log growth phase, growth was more continuous (monomorphic) and reached an OD600 of 1.33 at 14.7 hours (Figure 3C). Injection of chloramphenicol led to a decrease in growth relative to control cultures, with a maximum OD600 of 0.75 reached at 8.2 hours and declining thereafter, and with a slight increase in response to a final concentration of 36.6 μg/mL compared to 7.7 μg/mL (Figure 3D). Figure 4 presents these growth curve data reduced to maximum OD600 (A) and time to maximum OD600 (B).
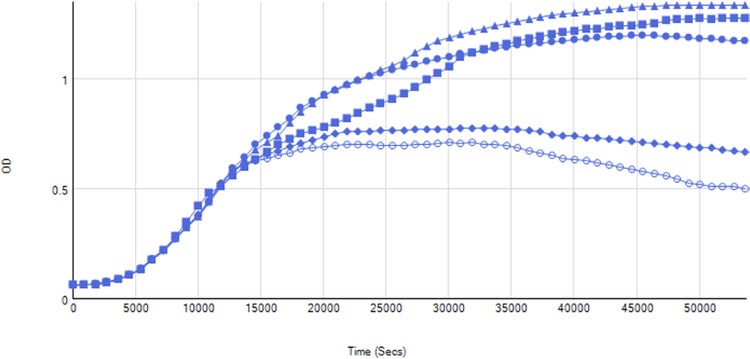
Figure 2. Continuous kinetic traces of E. coli growth. Single representative wells of different growth conditions are shown to illustrate the variation in growth observed.
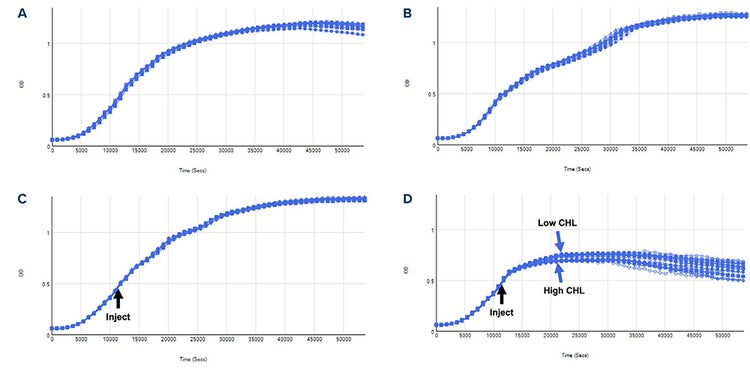
Figure 3. Kinetic traces of replicate wells. A, control; B, glucose added at time zero; C, glucose added by injector at mid-log phase; D, high or low concentration of chloramphenicol (CHL) added by injector at mid-log phase of growth.
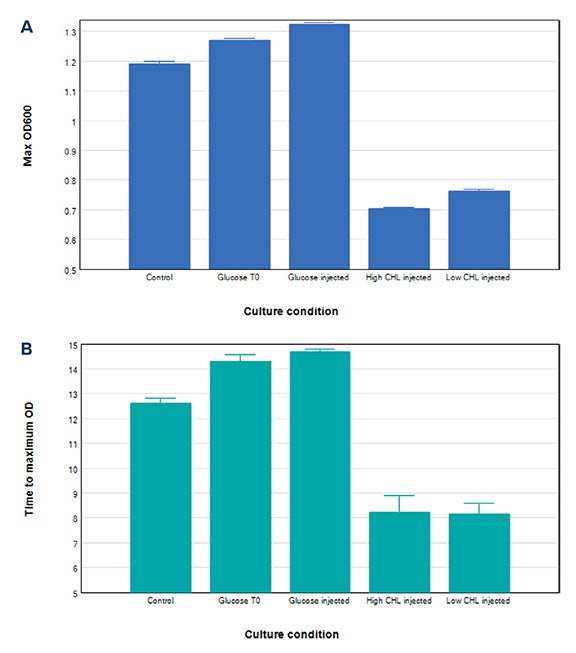
Figure 4. Raw kinetic growth curve data with calculations applied using the data reduction function in SoftMax Pro software. Results for different culture conditions were plotted: A, maximum OD600 reached during the kinetic read; B, time required (hours) to reach maximum OD60
Conclusions
When glucose is added to LB broth at the start of bacterial culture (e.g., E. coli), it acts as a preferred carbon source. LB broth itself contains amino acids and peptides from tryptone and yeast extract, which bacteria can also metabolize. Growth proceeds, beginning with phase 1, when bacteria consume glucose first due to catabolite repression, which suppresses genes for metabolizing other carbon sources. This leads to an initial exponential growth phase. Next comes a lag phase of metabolic adjustment, which occurs once glucose is depleted and bacteria pause to reprogram gene expression (e.g., activate operons for amino acid metabolism) – this creates a visible dip or plateau in the growth curve. Finally, bacteria enter phase 2, when bacteria resume growth using the amino acids and peptides in LB broth. This second phase of growth is usually a little slower than glucose metabolism. This two-phase pattern is known as diauxic growth, and it is well-documented in E. coli grown in media containing both glucose and alternative carbon sources1,2.
Here, we observed that in cultures where glucose was introduced during the mid logarithmic phase, the growth profile differed markedly from the diauxic-like pattern observed when glucose was present from the start. Instead of a biphasic curve with a transient lag, the OD₆₀₀ trace followed a continuous sigmoidal trajectory. This indicates that cells already metabolically engaged with amino acids and peptides in LB were able to incorporate glucose into central metabolism without requiring a major regulatory reset. The absence of a lag phase suggests that catabolite repression was less pronounced under these conditions, as the transcriptional and enzymatic machinery for alternative nutrient utilization was already active.
Metabolite studies support this interpretation: Nanchen et al. (2006) showed that intracellular fluxes in E. coli depend nonlinearly on growth rate, with cells in active log phase maintaining flexible metabolic states3. Enjalbert et al. (2015) demonstrated that acetate fluxes become significant once glucose is depleted, but when glucose is added mid growth, acetate accumulation is reduced, smoothing the metabolic transition4. More recent systems level analyses (Succurro et al., 2019; Karlsen et al., 2023) highlight that population heterogeneity and timing of substrate availability strongly influence whether a lag emerges5,6. Together, these findings explain why mid log glucose addition results in a smooth S curve: the culture integrates the new carbon source seamlessly into an already mixed substrate metabolism, avoiding the hallmark pause of diauxic growth.
Chloramphenicol is a broad spectrum antibiotic that acts by binding to the 50S ribosomal subunit of bacteria, where it inhibits the peptidyl transferase activity responsible for peptide bond formation. By blocking this critical step in protein synthesis, it exerts a bacteriostatic effect, halting bacterial growth without directly killing the cells, though it can be bactericidal against certain pathogens at high concentrations as expected, adding chloramphenicol to E. coli in mid-log phase led to inhibition of growth. This was evidenced by the reduction of maximum OD600, which was reached more than 8 hours earlier than in control wells. This growth pattern is consistent with chloramphenicol’s primarily bacteriostatic mode of action. A small but notable reduction in maximum OD600 was observed with 36.6 μg/mL chloramphenicol compared to 7.7 μg/mL.
Summary
The effects on bacterial growth induced by the addition of nutrients or antibiotics can be easily visualized from the raw kinetic data obtained using the SpectraMax iD3s reader and versatile workflow setup in SoftMax Pro software. Onboard injectors enable the execution of more complex experiments with timed additions of reagents while growth data are being generated. The Advanced Shake feature allows users to select optimal shaking conditions.
References
- Monod, J. (1949). The growth of bacterial cultures. Annu. Rev. Microbiol., 3, 371–394.
- Sezonov, G., Joseleau Petit, D., & D’Ari, R. (2007). Escherichia coli physiology in Luria–Bertani broth. J. Bacteriol., 189(23), 8746–8749.
- Nanchen, A., Schicker, A., & Sauer, U. (2006). Nonlinear dependency of intracellular fluxes on growth rate in mini chemostat cultures of E. coli. J. Bacteriol., 188(7), 2466–2479.
- Enjalbert, B., Millard, P., Dinclaux, M., Portais, J. C., & Létisse, F. (2015). Acetate fluxes in E. coli are determined by thermodynamic control of the Pta AckA pathway. Sci. Rep., 5, 15287.
- Succurro, A., Segrè, D., & Ebenhöh, O. (2019). Emergent subpopulation behavior uncovered with a community dynamic metabolic model of E. coli diauxic growth. mSystems, 4(1).
- Karlsen, E., Gylseth, M., Schulz, C., & Almaas, E. (2023). A study of a diauxic growth experiment using an expanded dynamic flux balance framework. PLoS ONE, 18(1): e0280077.