
Application Note
Characterize biologics for immune checkpoint blockade with reporter bioassays using SpectraMax microplate readers
- Easily measure potency and stability of biologics designed to block immune checkpoint signals
- Minimize hands-on time and improve assay reproducibility with Thaw-and-Use assay format
- Obtain robust assay performance with luciferase-based reporter
- Achieve high sensitivity with versatile multi-mode readers
- Get results faster with automatic data analysis
Cathy Olsen, PhD | Sr. Applications Scientist | Molecular Devices
Zhijie Jey Cheng, PhD | R&D Manager and Sr. Research Scientist III | Promega Corporation
Introduction
Immune checkpoint receptors are promising immunotherapy targets for the treatment of a variety of diseases including cancer and autoimmune-mediated disorders. Several co-inhibitory receptors such as programmed cell death protein 1 (PD-1), cytotoxic T-lymphocyte associated protein 4 (CTLA-4), T cell immunoreceptor with immunoglobulin and immunoreceptor tyrosine-based inhibitory motif (TIGIT), T cell immunoglobulin and mucin-domain containing-3 (TIM-3) and lymphocyte activation gene-3 (LAG-3) have been identified as targets for monoclonal antibodies to block co-inhibitory signals such that an active immunotherapy is launched against cancer.
Furthermore, preclinical studies involving a combination of immunotherapy targets suggest that these can have a synergistic effect on T cell activation, anti-tumor responses, and patient survival. Developing therapeutics that inhibit either one or two immune checkpoint receptors simultaneously poses challenges for in vitro testing. Current methods used to measure the activity of drugs targeting immune checkpoints rely on primary human T cells and measurement of functional endpoints such as cell proliferation, cell surface marker expression, and interferon gamma and interleukin-2 production. These assays are laborious and highly variable due to their reliance on donor primary cells, complex assay protocols, and unqualified assay reagents.
Promega has developed a suite of functional reporter bioassays to enable the research and drug development of a variety of immune checkpoint targets, including the two featured in this application note, TIGIT and CTLA-4. Each kit offers Thaw-and-Use cells that eliminate the need for primary cell culture and enable a shorter time to result.
The TIGIT/CD155 Blockade Bioassay consists of two genetically engineered cell lines: TIGIT Effector Cells, Jurkat T cells expressing human TIGIT with a luciferase reporter driven by a native promoter that can respond to both TCR activation and CD226 co-stimulation; and CD155 aAPC/CHO-K1 Cells, CHO-K1 cells engineered to express human CD155 with an engineered cell-surface protein designed to activate the TCR complex in an antigen-independent manner. When the two cell types are co-cultured, TIGIT inhibits CD226 activation and promoter-mediated luminescence. Addition of an anti-TIGIT antibody blocks the interaction of TIGIT with CD155 or inhibits the ability of TIGIT to prevent CD226 homodimerization, resulting in promoter-mediated luminescence (Figure 1).
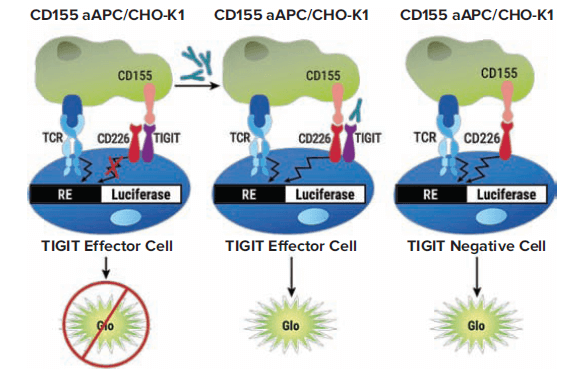
Figure 1. TIGIT/CD155 Blockade Bioassay principle. The bioassay consists of two genetically engineered cell lines, TIGIT Effector Cells and CD155 aAPC/CHO-K1 Cells. Left: When co-cultured, TIGIT inhibits CD226 pathway-activated luminescence. The addition of anti-TIGIT antibody blocks the TIGIT/CD155 interaction, thereby re-establishing CD226 pathway-activated luminescence, which can be detected in a dose-dependent manner by addition of BIo-Glo™ Reagent and quantitation with a luminometer. Middle: When co-cultured with non-TIGIT-expressing Effector Cells, CD155 induces luminescence by activation of the CD226 pathway. (Graphic courtesy of Promega Corporation)
The CTLA-4 Blockade Bioassay consists of two genetically engineered cell lines: CTLA-4 Effector Cells, Jurkat T cells stably expressing human CTLA-4 and a luciferase reporter driven by a native promoter which responds to TCR/CD28 activation; and aAPC/Raji Cells, Raji cells expressing an engineered cell surface protein designed to activate cognate TCRs in an antigen-independent manner and endogenously expressing CTLA-4 ligands CD80 and CD86. When the two cell types are co-cultured, CTLA-4 competes with CD28 for their shared ligands, CD80 and CD86, and thus inhibits CD28 pathway activation and promoter-mediated luminescence. Addition of an anti-CTLA-4 antibody blocks the interaction of CTLA-4 with its ligands CD80 and CD86 and results in promoter-mediated luminescence (Figure 2).
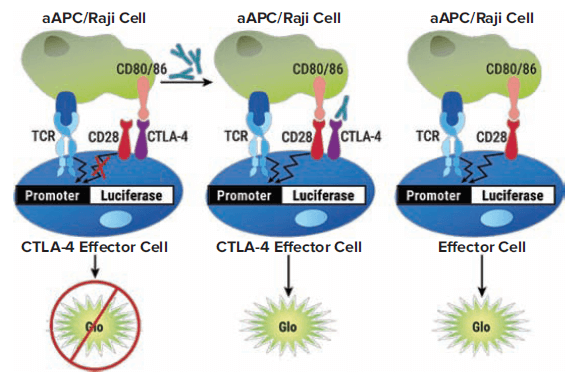
Figure 2. CTLA-4 Blockade Bioassay principle. The bioassay consists of two genetically engineered cell lines, CTLA-4 Effector Cells and aAPC/Raji Cells. Left: When co-cultured, the CTLA-4/CD80 and CD86 interaction inhibits CD28 pathway-activated luminescence. The addition of anti-CTLA-4 antibody blocks the CTLA-4/CD80 and CD86 interaction, thereby re-establishing CD28 pathway-activated luminescence, which can be detected in a dose-dependent manner by addition of Bio-Glo™ Reagent and quantitation with a luminometer. Middle: When co-cultured with non-CTLA-4-expressing Effector Cells, activation also induces luminescence by activation of the CD28 pathway, but in a manner independent of anti-CTLA-4 antibody. (Graphic courtesy of Promega Corporation)
Thanks to their robust luminescent readout, both assays are readily detected on a microplate reader with luminescence detection mode. Here we compared multiple microplate readers from Molecular Devices with these two assays. They include the SpectraMax® iD3 Multi-Mode Microplate Reader, SpectraMax® L Microplate Reader, SpectraMax® i3x Multi-Mode Microplate Reader, and SpectraMax® M5 Multi-Mode Microplate Reader. All the readers were operated using SoftMax® Pro Software, which also has built-in data analysis and curve-fitting for automatic calculation of EC50 response values and easy data set comparison.
Materials
TIGIT/CD155 assay
- TIGIT/CD155 Blockade Bioassay (Promega cat. #J2201, J2205)
- Control Ab, Anti-TIGIT (Promega cat. #J2051)
CTLA-4 assay
- CTLA-4 Blockade Bioassay (Promega cat. #JA3001, JA3005)
- Control Ab, Anti-CTLA-4 (Promega cat. #JA1020)
Other materials and equipment
- White, tissue culture-treated, flat bottom 96-well assay plates (Corning cat. #3917)
- CO 2 Incubator, 37°C, 5% CO2, humidified
- SpectraMax® iD3 Multi-Mode Microplate Reader (cat. #ID3-STD)
- SpectraMax® i3x Multi-Mode Microplate Reader (cat. #i3X)
- SpectraMax® M5 Multi-Mode Microplate Reader (cat. #M5)
- SpectraMax® L Microplate Reader (cat. #SpectraMax L Config)
Methods
TIGIT/CD155 Blockade Bioassay
The day before assay, assay buffer was prepared as described in the product technical manual. One vial of Thaw-and-Use TIGIT Effector Cells was thawed and resuspended in cell recovery medium. The cell suspension was added into the inner 60 wells of a 96-well white, flat-bottom assay plate. The plate was incubated overnight in a CO2 incubator at 37°C.
On the day of assay, a serial dilution of the Control Ab, Anti-TIGIT, was prepared to make a full ten-point dose-response curve. One vial of Thaw-and-Use CD155 aAPC/CHO-K1 Cells was thawed and resuspended in assay buffer. The assay plates containing TIGIT Effector cells were then taken from the incubator. The serial dilutions of control antibody were added to the inner wells containing TIGIT Effector cells, followed by the addition of CD155 aAPC/CHO-K1 Cells. The plate was lidded and incubated for six hours in a 5% CO2 humidified incubator at 37°C.
CTLA-4 assay
On the day of assay, assay buffer was prepared as directed in the product insert. A serial dilution of the Control Ab, Anti-CTLA-4, was prepared to make a full dose-response curve. Antibody dilutions were set aside for later addition to cells. A vial of Thaw-and-Use CTLA-4 Effector Cells was thawed and resuspended in assay buffer. The cell suspension was added into the inner 60 wells of a 96-well white, flat-bottom assay plate followed by the addition of the serial dilutions of control antibody.
A vial of Thaw-and-Use aAPC/Raji Cells was then thawed and resuspended in assay buffer. The cell suspension was added to the inner 60 wells of the assay plate already containing CTLA-4 Effector Cells and antibody mixture. The plate was lidded and incubated for 16 hours at 37°C in a 5% CO2 humidified incubator.
Bio-Glo Luciferase Assay Detection
During the induction period for the assays, Bio-Glo™ Luciferase Assay Buffer was warmed to room temperature. Bio-Glo™ Luciferase Assay System was reconstituted by transferring one bottle of Bio-Glo buffer to the bottle containing Bio-Glo™ Substrate.
After the 6- or 16-hour induction, the assay plate was equilibrated to room temperature for 10-15 minutes. An equal volume of reconstituted Bio-Glo™ Reagent was added to every well containing cells. Plates were incubated for 5–10 minutes at room temperature. Luminescence was measured in Molecular Devices microplate readers with luminescence detection mode using a one-second integration time.
Data analysis
Normalized RLU values were calculated by setting the maximum RLU value obtained for each instrument to 100%, then scaling the remaining RLU values accordingly. Data were graphed as raw RLU or normalized RLU versus antibody concentration. EC50 values were obtained by built-in data analysis and four-parameter logistic curve-fitting with SoftMax Pro Software.
Results
After a 6- or 16-hour induction, luciferase activity was measured on SpectraMax readers with luminescence detection mode. Raw RLU and normalized RLU values were plotted in SoftMax Pro Software using a 4-parameter curve fit (Figure 3A and 3B, 4A and 4B). For both assays, the SpectraMax L reader gave the highest RLU values, whereas the SpectraMax M5 reader gave the lowest RLU values (Table 1). Normalization of the RLU values revealed that the data from all instruments were similar. For all readers, the observed EC50 values were very consistent, ranging from 1.05 to 1.31 μg/mL for anti-TIGIT antibody, and ranging from 1.69 to 1.82 μg/mL for anti-CTLA-4 antibody (Table 1).
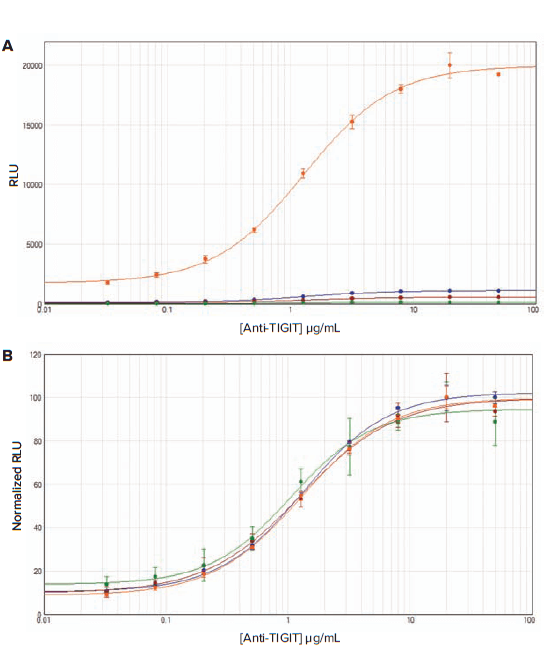
Figure 3. Assay response to Control Ab, Anti-TIGIT in TIGIT/CD155 blockade assay. Thaw-and-Use TIGIT Effector Cells were plated and incubated overnight. The following day, a titration of Control Ab, anti-TIGIT, was added, followed by the addition of CD155 aAPC/CHO-K1 Cells. After six hours of induction at 37°C, Bio-Glo Luciferase Assay Reagent was added and luminescence was measured. RLU values (A) and normalized RLU values (B) obtained with the SpectraMax readers are shown (orange, SpectraMax L; blue, SpectraMax iD3; red, SpectraMax i3x; green, SpectraMax M5). Four-parameter logistic curve analysis was performed with SoftMax Pro Software.
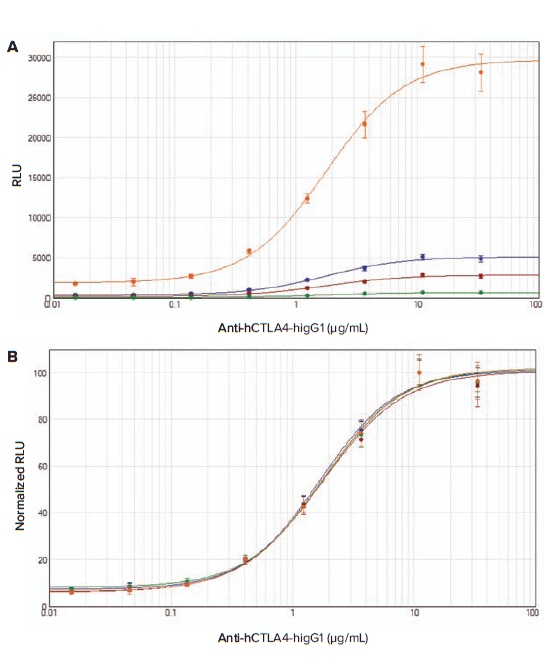
Figure 4. Assay response to Control Ab, Anti-CTLA-4 in CTLA-4 blockade assay. Thaw-and-Use CTLA-4 Effector Cells were plated into a white 96-well assay plate. Serial dilutions of Control antibody, Anti-CTLA-4, were added to CTLA-4 Effector Cells. The aAPC/Raji cells were then added to the CTLA-4 Effector cells and antibody in the assay plate. After incubation for 16 hours at 37°C/5% CO2, Bio-Glo Luciferase Assay Reagent was added, and luminescence was measured. RLU values (A) and normalized RLU values (B) obtained with the SpectraMax readers are shown (orange, SpectraMax L; blue, SpectraMax iD3; red, SpectraMax i3x; green, SpectraMax M5). Four-parameter logistic curve analysis was performed with SoftMax Pro Software.
Conclusion
The TIGIT/CD155 and CTLA-4 Blockade Bioassays offer users a biologically relevant way to measure a biologic’s mechanism of action. These bioassays combine a simple, add-mix-read workflow with engineered effector cells and aAPC cells. The bioassays are simple, robust, and prequalified according to International Council for Harmonisation of Technical Requirements for Pharmaceuticals for Human Use (ICH) guidelines, and show the precision, accuracy, and linearity required for routine use in potency and stability studies. The timeframe of the assay can be varied, and the decision of what assay time to use will depend in part on the luminescence reader sensitivity, apart from workflow preference. With the Thaw-and-Use cell format, there is no cell culture required, and the assays are easily implemented in 96- or 384-well format. The robust and reproducible luminescence-based readout of the assays makes them ideal for use with a variety of SpectraMax® readers. The rapid and convenient workflow is complemented by SoftMax Pro Software’s automated data analysis and graphing.
Uninduced
RLU
EC
50
response
(μg/mL)
Table 1. EC50 responses determined on SpectraMax readers. Results for both TIGIT/CD155 and CTLA-4 Blockade Bioassays calculated by SoftMax Pro Software are shown.