
Application Note
Cell-based measurement of ERK1/2 phosphorylation with THUNDER TR-FRET assay
- Highly robust homogeneous (no-wash) assay with simple and fast assay workflow
- Highly sensitive assay generating well-defined, complete concentration-response curves without the need to serum starve the cells
- EC 50 and IC 50 values in agreement with published data
- Suitable for both academic and drug discovery applications
Joyce Itatani | Applications Scientist | Molecular Devices
Cathy Olsen, PhD | Sr. Applications Scientist | Molecular Devices
Introduction
The MAPK/ERK cell signaling pathway begins with the activation of a receptor tyrosine kinase located at the cell surface, involves a series of kinase phosphorylation steps (kinase cascade), and culminates in the activation of transcription factors that effect changes in gene expression. ERK1 and ERK2, also referred to as ERK1/2, are phosphorylated as part of this pathway, and go on to phosphorylate and activate other targets, including transcription factors involved in cell proliferation and differentiation. Disruption or dysregulation of the pathway can lead to the development of a variety of cancers1.
THUNDER™ is a versatile and cost-effective cell-based assay platform developed by Bioauxilium Research for measuring individual phosphorylated and total endogenous proteins in a manner compatible with both academic and drug discovery research. The THUNDER™ Phospho-ERK1/2 (T202/Y204) assay kit is a homogeneous time-resolved Förster resonance energy transfer (TR-FRET) sandwich immunoassay with a simple workflow consisting of three steps (Figure 1). After cell treatment, cells are lysed, and Phospho-ERK1/2 (T202/Y204) in the lysates is detected using a pair of fluorophore-labeled antibodies in a single-step reagent addition with no wash steps. The first antibody, Eu-Ab1, is labeled with a Europium chelate that acts as the donor fluorophore. The second antibody, FR-Ab2, is labeled with a far-red acceptor fluorophore.

***Figure 1.*The THUNDER TR-FRET workflow consists of three steps and no washes. The two-plate (transfer) method is shown.
Binding of these two labeled antibodies to different epitopes on the target ERK1/2 protein brings the donor and acceptor fluorophores into close proximity, and excitation of the donor Europium chelate triggers a FRET to the acceptor fluorophore, resulting in a TR-FRET signal at 665 nm (Figure 2). Residual energy from the Europium chelate generates light at 615 nm. The signal at 665 nm is proportional to the amount of Phospho-ERK1/2 (T202/ Y204) in the cell lysate, and data may be expressed as either the signal at 665 nm or the 665 nm/615 nm ratio.

***Figure 2.*THUNDER TR-FRET sandwich immunoassay. Binding of both the Eu-Ab1 and FR-Ab2 to the analyte enables a transfer of energy from the Europium chelate to the acceptor fluorophore, resulting in signal at 665 nm that is detected using a microplate reader with time-resolved detection mode.
Here, we demonstrate how the cost-effective THUNDER Phospho-ERK1/2 (T202/Y204) assay can be used to measure EGF-induced phosphorylation of ERK1/2 in HEK293 cells. We also show how inhibition of this phosphorylation by Erlotinib (Tarceva®), a drug used to treat non-small cell lung cancer and pancreatic cancer2, is assessed. SpectraMax® iD5, i3x, and M5e Multi-Mode Microplate Readers, with SoftMax® Pro Software, generate robust assay data with streamlined data analysis and graphing.
Materials
- THUNDER Phospho-ERK1/2 (T202/Y204) TR-FRET Cell Signaling Assay Kit (Bioauxilium cat #KIT-ERKP-100)
- 96-well clear, poly-L-lysine-coated microplate (Corning cat. #354516)
- 96-well half-area white microplate (Corning cat. #3693)
- HEK293 cell line (ATCC cat. #CRL-1573)
- Growth medium: MEM (Minimum Essential Medium) containing phenol red (Corning cat. #10-010-CV) + 10% fetal bovine serum (FBS, Avantor Seradigm cat. #1500-500) + 1% penicillin/streptomycin (Thermo Fisher cat. #15070)
- Recombinant human EGF (R&D Systems cat. #236-EG)
- Erlotinib hydrochloride (Sigma cat. #SML2156)
- Water, molecular biology grade (Growcells cat. #NUPW-0050)
- SpectraMax iD5 Multi-Mode Microplate Reader (Molecular Devices cat. #iD5-STD) equipped with the following:
- Enhanced TRF Module
- Filters: 320 nm BW 100 nm, 616 nm BW 10 nm, 665 nm BW 10 nm
- SpectraMax i3x Multi-Mode Microplate Reader (Molecular Devices cat. #i3x)
- TR-FRET Detection Cartridge (HTRF®, Molecular Devices P/N 0200-7011)
- SpectraMax M5e Multi-Mode Microplate Reader (Molecular Devices cat. #M5e)
Methods
Cell preparation
HEK293 cells in growth medium (MEM/10% FBS/1% penicillin/streptomycin) were seeded at 50,000 cells per well, 50 μL per well, in a 96-well poly-L-lysine-coated microplate. Cells were allowed to attach and grow overnight at 37°C, 5% CO2. No serum starvation was required.
Reagent preparation
- 1X Supplemented Lysis Buffer was made by diluting the 5X Lysis Buffer 1 to 1X with ultrapure water and adding the 100X Phosphatase Inhibitor Cocktail diluted to a final concentration of 1X. The Supplemented 1X Lysis Buffer 1 contained 1 mM sodium fluoride, 2 mM sodium orthovanadate, and 2 mM beta-glycerophosphate.
- 1X Detection Buffer was made by diluting the 10X Detection Buffer with ultrapure water.
- A 4X Antibody Detection Mix in 1X Detection Buffer was made according to the directions in the user manual. For the 100-point kit, 255 μL of 1X Detection Buffer was added to the vial containing 5 μL of Eu-Ab1 stock solution. 240 μL of 1X Detection Buffer was added to the vial containing 20 μL FR-Ab2 stock solution. The 260 μL of pre-diluted Eu-Ab1 and 260 μL of pre-diluted FR-Ab2 were combined and mixed gently.
EGF Stimulation
50 μL of a 2X working solution of EGF ranging from 10 nM to 0.003 nM was added to cells in duplicate wells, and cells were incubated for 10 minutes at room temperature. The media was then aspirated gently to avoid disturbing the cell layer. 50 μL of 1X Supplemented Lysis Buffer was added to the wells, and the plate was incubated for 30 minutes at room temperature on an orbital shaker.
After incubation, 15 μL of cell lysate from each well was transferred to a 96-well half area white microplate. 5 μL of 4X Antibody Detection Mix was added to each well, and the plate was covered with a plate seal and incubated for four hours at room temperature. The plate was then read on the SpectraMax iD5, SpectraMax i3x and SpectraMax M5e readers using the settings in Table 1.
TR-FRET
(Enhanced TRF Module and filters must be installed)
Use Filters
Excitation: 320 nm*
Emission 1: 616 nm
Emission 2: 665 nm
Excitation: 340 nm
Emission 1: 616 nm
Emission 2: 665 nm
Excitation: 314 nm
Emission 1: 616 (Cutoff 570 nm)
Emission 2: 665 (Cutoff 630 nm)
Flashes per read: 100
Excitation time: 0.05 ms
Measurement delay: 0.05 ms
Integration time: 0.3 ms
Read height: 9.31 mm
Pulses: 100
Excitation time: 0.05 ms
Measurement delay: 0.05 ms
Integration time: 0.3 ms
Read height: 6.28 mm
Flashes per read: 100
Measurement delay: 0.1 ms
Integration time: 0.3 ms
*Use of the 320 nm Ex filter yields optimal results with the SpectraMax iD5 reader, although a standard 340 nm filter can be used.
Table 1. Recommended settings for SpectraMax iD5, i3x, and M5e readers. For SpectraMax iD5 and i3x readers, microplate and read height should be optimized for each new lot of microplates or assay volume used (use the Show Pre-Read Optimization options in the instrument settings in SoftMax Pro Software).
Erlotinib inhibition
25 μL of 4X working dilutions of erlotinib was added to the cells, resulting in final concentrations ranging from 10 μM to 0.001 μM in 1:3 serial dilutions. The plate was incubated for 15 minutes at room temperature. Cells were then stimulated with EGF at the EC80 of 0.7 nM, determined as described in the EGF stimulation assay above. 25 μL of a 4X working solution of EGF at EC80 (2.8 nM) was added to the wells, and the plate was incubated for 10 minutes at room temperature. The media was carefully removed and 50 μL of 1X Supplemented Lysis Buffer was added to each well. The plate was then incubated for 30 minutes at room temperature on an orbital shaker.
After incubation, 15 μL of cell lysate from each well was transferred to a 96-well half area white microplate. 5 μL of 4X Antibody Detection Mix was added to each well, and the plate was covered with a plate sealer and incubated for four hours at room temperature. The plate was then read on the SpectraMax iD5, SpectraMax i3x, and SpectraMax M5e readers using the settings in Table 1.
Data analysis
TR-FRET ratios were calculated by dividing the RFU value for the 665-nm reading by the RFU value for the 616-nm reading, and the resulting numbers were multiplied by 1000. Background subtraction was not necessary. The TRFRET ratios were plotted versus concentration of EGF (for the stimulation assay) or Erlotinib (for the inhibition assay) using a 4-parameter logistic equation in SoftMax Pro Software. From the resulting curves, EC50 and IC50 values were automatically calculated by the software.
Results
EGF stimulation of HEK293 cells resulted in an increase in ERK1/2 (T202/Y204) phosphorylation, with a concentration response that followed a sigmoidal curve. TR-FRET ratios were plotted against EGF concentration using a 4-parameter logistic curve fit, from which EC50 values from 0.28 nM to 0.41 nM were calculated for data obtained with the SpectraMax readers (Figure 3). These values were consistent with published EC50 values for the THUNDER TR-FRET assay3.
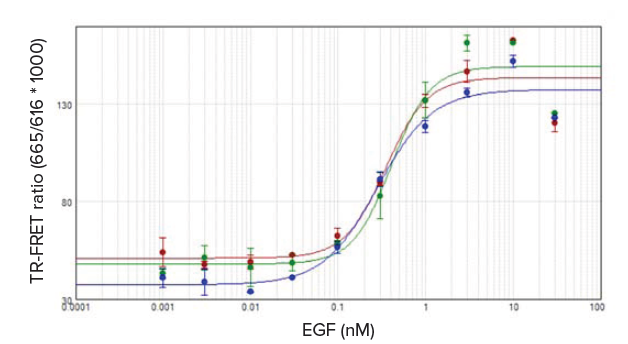
***Figure 3.*Concentration-dependent ERK1/2 (T202/Y204) phosphorylation induced by EGF. Results obtained with SpectraMax iD5 (red), i3x (green), and M5e (blue) readers were plotted using a 4-parameter logistic, and EC50 values of 0.28 nM to 0.41 nM were calculated using SoftMax Pro Software.
Note: for the THUNDER assay, performance of a SpectraMax M5e reader will be equivalent to that of a SpectraMax M5 reader.
The ability to measure inhibition of phosphorylation by Erlotinib was tested by incubating cells with increasing concentrations of Erlotinib, then stimulating cells with 0.7 nM EGF, the EC80 concentration determined from the initial stimulation assay. IC50 values from 42 nM to 63 nM were calculated from the resulting 4-parameter curve fits for each SpectraMax reader in SoftMax Pro Software (Figure 4). Again, this was consistent with previously published values3.
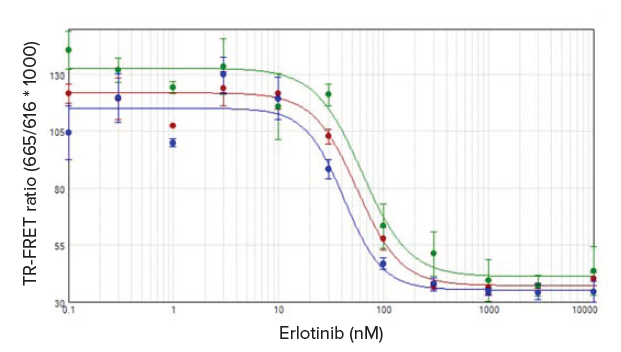
***Figure 4.*Inhibition of EGF-induced phosphorylation of ERK1/2 (T202/Y204) by Erlotinib. Data obtained with SpectraMax iD5 (red), i3x (green), and M5e (blue) readers were plotted using a 4-parameter logistic in SoftMax Pro Software, and IC50 values of 42 to 63 nM were calculated from the curve
EC
50
(EGF)
IC
50
(Erlotinib)
Table 2. Summary of data for the THUNDER Phospho-ERK1/2 (T202/Y204) TR-FRET assays. Shown are the EC50, IC50, and assay signal/background ratios obtained with each reader for EGF-induced phosphorylation and for inhibition of phosphorylation by Erlotinib.
Conclusion
Overall, the THUNDER Phospho-ERK1/2 (T202/Y204) assay showed robust TR-FRET signals, wide dynamic ranges, high S/B ratios, and the expected pharmacology on SpectraMax iD5, i3x, and M5e readers. The current data validates the THUNDER cell signaling assay platform on Molecular Devices readers.
References
- Braicu C, Buse M, Busuioc C, Drula R, Gulei D, Raduly L, Rusu A, Irimie A, Atanasov AG, Slaby O, Ionescu C, and Berindan- Neagoe I. A comprehensive review on MAPK: A promising therapeutic target in cancer. Cancers, 11(10) (2019), p 1618.
- Bareschino MA, Schettino C, Troiani T, Martinelli E, Morgillo F, and Ciardiello F. Erlotinib in cancer treatment. Annals of Oncology, 18:6 (2007), pp. vi35-vi41.
- THUNDER ™ Phospho-ERK1/2 (T202/Y204) TR-FRET Cell Signaling Assay Kit Technical Data Sheet: https://bioauxilium.com/. com/product/phospho-erk1-2-t202-y204/