
Application Note
Assess cell viability and proliferation with colorimetric readouts
- Obtain convenient colorimetric readouts
- Assay as few as 300 cells per sample
- Reduce hands-on time with a single-reagent alternative method
Joyce Itatani | Applications Scientist | Molecular Devices
Cathy Olsen, PhD | Sr. Applications Scientist | Molecular Devices
Introduction
Tetrazolium salts such as MTT have long been employed in colorimetric assays to assess cellular metabolic activity. Viable cells produce enzymes that convert yellow MTT (3-(4,5- dimethylthiazol-2-yl)- 2,5-diphenyltetrazolium bromide) to insoluble purple formazan. The more viable cells present in a sample, the more intense the purple color. The formazan is solubilized via addition of a second reagent, and then the samples’ absorbance is measured at 590 nm in a microplate reader, providing a convenient readout for cell viability or proliferation.
Although easy to run, the MTT assay does require two reagent addition and incubation steps, reducing its appeal when time is limited or samples are numerous. Here we compare an MTT assay from Abcam to the colorimetric Cell Cytotoxicity Assay, also from Abcam, that uses a proprietary water-soluble dye whose absorption spectrum changes upon cellular reduction. In this assay, a single reagent is added to cells, and after incubation, absorbance is measured at 570 nm and 675 nm. The absorbance ratio (OD570/OD675) is proportional to the number of viable cells in the sample.
The MTT and the Cell Cytotoxicity kits can both be used to measure cell proliferation (viable cells) and cytotoxicity. The choice will be based mainly on the desired workflow and time required. Detection of a range of viable cell numbers was performed by plating a dilution series of HeLa cells in 96-well plates and assaying with both kits. Cytotoxicity was measured by using both kits to assay HeLa cells treated with doxorubicin, a chemotherapy drug that stops or slows the growth of cancer cells by inhibiting the enzyme topoisomerase 2. Both the MTT and Cell Cytotoxicity assays were read on the SpectraMax® ABS Plus Microplate Reader, which can read a 96-well microplate in less than 10 seconds. Up to 70% savings in overall assay time can be gained when using the Cell Cytotoxicity assay (Figure 1).
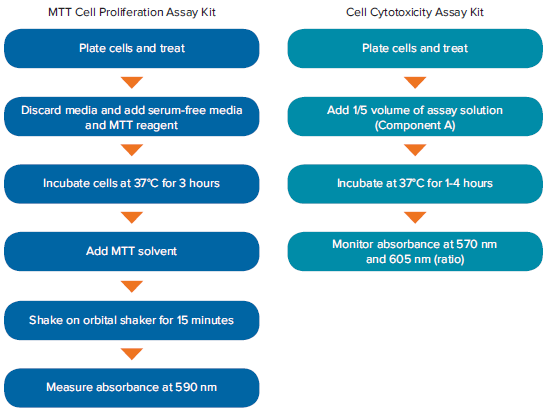
Figure 2. Workflows of the MTT Cell Proliferation and Cell Cytotoxicity Assay Kits. The Cell Cytotoxicity Assay Kit shortens overall assay time up to 70% by reducing reagent additions and incubation time.
Methods
Kits and other materials used
- MTT Cell Proliferation Assay Kit (Abcam cat. #ab211091)
- Cell Cytotoxicity Assay Kit – Colorimetric (Abcam cat. #ab112118)
- Doxorubicin (Tocris cat. #2252)
- HeLa cells (ATCC cat. #CCL-2)
- Corning 96-well black microplates with clear bottom (Corning cat. #3603)
- SpectraMax ABS Plus Microplate Reader (Molecular Devices cat. #ABS Plus)
Cell plating and treatment prior to assay
To validate the assays’ ability to detect a wide range of viable cell numbers, a series of cell densities was set up. HeLa cells were plated at 156 to 10,000 cells per well in triplicate in 96-well microplates with a clear bottom and black walls. Control wells containing medium only (no cells) were included for use in data analysis. Cells were allowed to attach and grow overnight at 37°C, 5% CO2.
To measure cytotoxicity in compoundtreated cells, HeLa cells were plated at 10,000 cells per well and allowed to attach and grow overnight at 37°C, 5% CO2. The next day, doxorubicin was added to cells in triplicate wells, at concentrations from 30 μM down to 0.12 μM, in a 1:2 dilution series. The following controls were included for use in data analysis: (1) positive control containing cells and known cytotoxicity inducer (doxorubicin), (2) negative control containing cells but no test compound, (3) vehicle control containing cells and the vehicle used to deliver test compound (DMSO), and (4) non-cell control containing growth medium without cells. Cells were treated overnight at 37°C, 5% CO2.
Both kits were used to assay the viable cell density series, as well as cytotoxicity in doxorubicin-treated cells.
MTT assay procedure
Medium on the cells was aspirated and replaced with 50 μL of phenol-red free, serum-free medium. 50 μL of MTT reagent was added to each well. The plate was placed on a shaker for 30 seconds and then incubated for 3 hours at 37°C, 5% CO2. 150 μL of MTT solvent was then added to each well to solubilize the formazan product, and the plate was placed on a shaker for 15 minutes. Absorbance was read at 590 nm on the SpectraMax ABS Plus Microplate Reader.
Cell Cytotoxicity assay procedure
20 μL of Component A was added to each well of the microplate. The plate was placed on an shaker for 15 seconds and then incubated for 2 hours at 37°C, 5% CO2. Absorbance (optical density, OD) was read at 570 nm and 605 nm on the SpectraMax ABS Plus Microplate Reader. For each sample, absorbance values were expressed as the OD570/OD605 ratio.
Proliferation and cytotoxicity data analysis
MTT assay
For the MTT assay, samples of varying cell densities were background corrected by subtracting the absorbance values of the no-cell control (background) from those of the cell-containing wells. Results were plotted as absorbance values versus cells per well.
The effect of doxorubicin treatment on cells was calculated using the following equation:
% Cytotoxicity = (100 X (Control – Sample)) / Control
Where Control is the absorbance value of untreated cells.
Cell Cytotoxicity assay
For the Cell Cytotoxicity assay, proliferation (cell density series) was analyzed by subtracting the average absorbance value (ratio) of the no-cell control from values of the cell wells. Cytotoxicity results for doxorubicin-treated cells were calculated using the same equation as was used with the MTT assay:
% Cytotoxicity = (100 X (Control – Sample)) / Control
All calculations were set up using the template editor and group tables, and results were plotted using the best curve fit, in SoftMax® Pro Software.
Results and Conclusion
Cell dilution series data were plotted as background-corrected absorbance values vs. cells per well (Figure 2). Both assays can readily measure cell densities from 10,000 to as few as 156 cells per well in a 96-well plate.

Figure 2. Mean absorbance value vs. cells per well graphed using the quadratic curve fit in SoftMax Pro Software. Blue plot, MTT assay (r2 = 0.999); red plot, Cell Cytotoxicity assay (r2 = 0.998).
The % cytotoxicity values for doxorubicintreated cells were plotted versus doxorubicin concentration (Figure 3). The MTT assay yielded an IC50 value of 3.1 μM, and the Cell Cytotoxicity assay gave a similar value of 2.1 μM.

Figure 3. % cytotoxicity shown for doxorubicin-treated cells using the MTT assay (blue plot) and Cell Cytotoxicity assay (red plot). Data are plotted using the 4-parameter curve fit in SoftMax Pro Software. Similar IC50 values of 3.1 μM and 2.1 μM, respectively, were calculated by the software.
Both the MTT Cell Proliferation assay and the Cell Cytotoxicity assay were used to (a) assess viability over a wide range of cell densities and (b) measure cytotoxicity in cells treated with doxorubicin. Each assay gives similar results, but the Cell Cytotoxicity assay offers the advantage of time savings due to its single-reagent format and reduced incubation time. Both assays enable labs to screen compound effects using absorbance-based detection available with the SpectraMax ABS Plus Microplate Reader, with results calculated and plotted in SoftMax Pro Software.