pCLAMP 11 Software Suite
Sophisticated patch-clamp electrophysiology data acquisition and analysis software
Patch-clamp analysis software with Clampfit Advanced Analysis Module
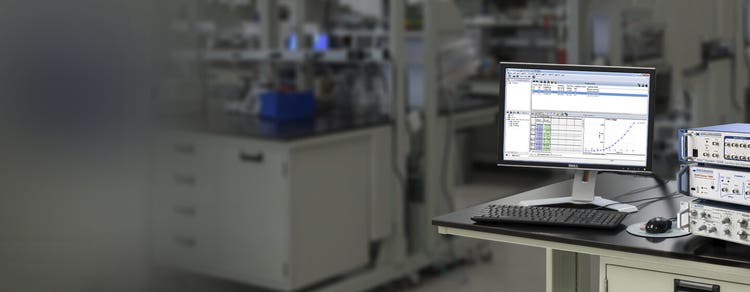
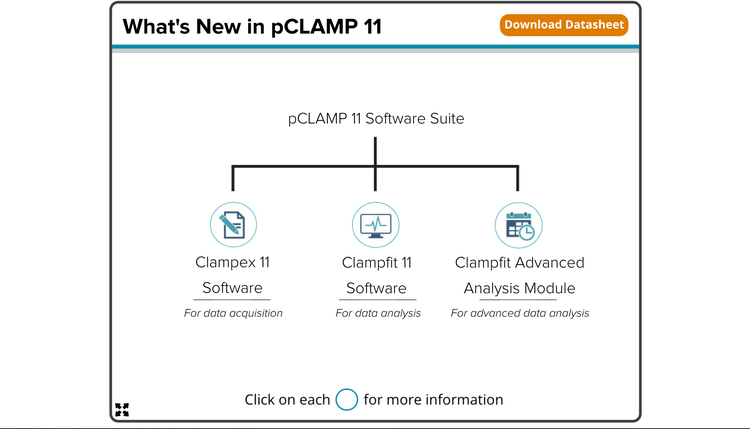
The pCLAMP™ Software Suite is an industry-leading patch-clamp electrophysiology data acquisition and analysis program for the control and recording of voltage-clamp, current-clamp, and patch-clamp experiments. The software suite consists of Clampex 11 Software for data acquisition, AxoScope 11 Software for background recording, Clampfit 11 Software for data analysis, and optional Clampfit Advanced Analysis Module for sophisticated and streamlined analysis.

Design advanced protocols easily
The enhanced protocol editor enables up to 50 epochs instead of 10, providing the flexibility to program longer, more sophisticated protocols.

Streamline workflows*
Batch analysis macros enable the analysis of data files in batches and eliminates the need to define parameters for every data set.

Analyze faster*
Automated event detection analyzes spontaneous and evoked action potentials and post-synaptic data. Identify events based on a variety of factors.
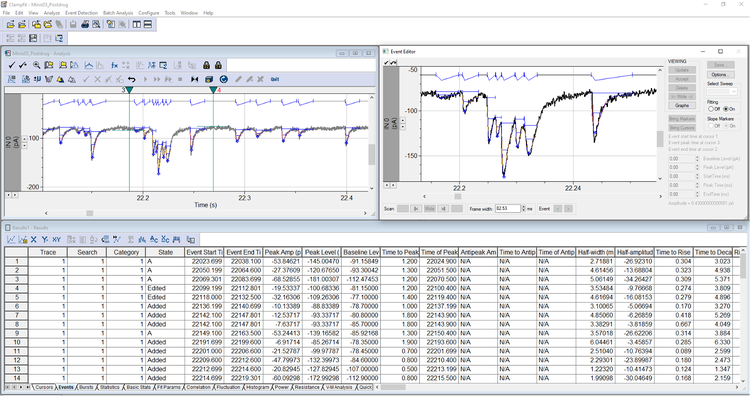
NEW Minis Analysis Feature
Introducing Minis Search, the latest innovation in Axon pCLAMP 11.4 software, designed to revolutionize how you analyze miniature excitatory and inhibitory post-synaptic currents (mEPSCs). These bioelectrical signals, vital for neuron communication, are now easier to detect and measure with this advanced event detection tool.
Minis Search offers a seamless and streamlined workflow that makes analyzing spontaneous or miniature events more efficient. Whether you're working with continuous or episodic-sweep data, you can now perform accurate measurements, easily manage event additions or deletions, and detect superimposed events with greater clarity. This feature empowers you to conduct your research with improved speed and precision, helping you achieve your scientific goals more effectively.
Streamline the workflow for detecting minis events

Achieve precise measurements for each detected event
Effortlessly add or delete events as needed

Detect superimposed events with confidence
Customers' First Impressions on Minis Search
Discover the excitement at the FENS Forum 2024 as neuroscientists share their first impressions of the new Minis Search feature in Axon pCLAMP Software. Watch as experts reveal how Minis Search is transforming the analysis of mEPSCs and mIPSCs with streamlined workflows, enhanced accuracy, and simplified event detection. See why Minis Search is generating buzz in the scientific community!
Features

Comprehensive analysis tools
The software includes a wealth of analysis tools including 24 cursor pairs for regions of interest search, graph plotting tools such as I-V plot and histogram, and more.

Improved visualization
The membrane testwindow displays up to eight channels simultaneously, making it easier to control multiple channels.

Enhanced gap-free mode
A simple continuous "chart-recorder" useful for monitoring single channel events, minis, and other spontaneous activities. Protocol-editor-style epochs and program digital or analog outputs can be executed.

Population spike analysis*
This tool automatically calculates amplitude, area under the curve, half-width, decay and rise time, decay and rise slope, coastline of spike, and paired pulses.

Action potential analysis*
This feature automatically detects and analyzes amplitude, APD90, rise and decay time, rise and decay slope, peak-to-peak frequency and time, and more.

Batch analysis*
Macros for batch analysis eliminates the need to define parameters for every data set. Saved macros can be applied to multiple data sets for automatic analysis.
*Clampfit Advanced Analysis Module only
FAQs
Do you need to buy additional features to gain access to advanced capabilities, like the Action Potential Analysis?
You do not need to buy ‘add-ons’ for our software, but which features you have access to depends on which version of pCLAMP 11 you purchase – the standard or the advanced version.
The advanced version contains all the capabilities of the full pCLAMP 11 suite for both the Clampfit and the Clampex software, including new features such as Action Potential Analysis, Population Spike Analysis and Batch Analysis, etc. It is possible to upgrade your Clampfit software suite swiftly and easily by purchasing an ‘advanced’ Clampfit dongle from us.
Can you filter multiple single-channel recordings using the batch analysis feature?
Yes, the Batch Analysis feature allows you to do this.
Can you use the filter function in pCLAMP 11 with multiple files simultaneously?
Yes, you can do this using the ‘batch analysis feature.
How do I use the Digitizer/Clampex software to control external devices?
Our digitizer uses digital outputs to control external devices, which could include a stimulus isolator, LED lights, perfusion system, etc. The digital output channel sends out a 5V TTL signal and controls the external devices. For example, you could connect a BNC cable from one of the digital output channels to the trigger input of a stimulus isolator. In Clampex software, you would then enable the digital outputs in the waveform tab. Each digit in the digital bit pattern corresponds to one of the digital output channels. Use “1” to turn on the corresponding channel and use “0” to turn off the corresponding channel.
Which Digidata units are compatible with pCLAMP 11?
The Digidata 1550, 1550A, 1550B, and 1440. However, it is not compatible with the Digidata 1322A or older units. For more information, please visit our support page.
Can I install Clampfit 11 to analyze data on my personal laptop?
The standard version of Clampfit 11 can be installed on any compatible computer running Windows 7/10 Professional or Enterprise, which meets the specifications. The Clampfit 11 dongle is required if you are planning to use advanced features such as batch analysis, automated action potential analysis, and automated population spike analysis. Please note we only support professional or enterprise version operating system.
Why do I receive two dongles for pCLAMP 11 software?
You will receive two dongles when you purchase the advanced version of pCLAMP 11. The black dongle is for Clampex software, and the white dongle is for Clampfit software.
Could I install and use Clampfit 11 software for data analysis on multiple computers?
Yes. Clampfit 11 software can be installed on multiple computers for data analysis. New features, including Action Potential Search, Population Spike Search, and Batch Analysis, are enabled in the presence of the Clampfit dongle.
My pCLAMP 11 software is the Standard version. How can I get a Clampfit 11 dongle?
The Clampfit 11 dongle is available to be purchased separately. Please contact your local account manager for more details.
My pCLAMP 10/11 Software dongle is not recognized by the Clampex Software. What should I do?
Make sure that when the pCLAMP 10/11 Software is installed, both the digitizer and the dongle are disconnected. During the installation process, the main program will run first, and after that, the Sentinel HASP driver installer will pop up. Make sure that the HASP driver is installed completely.
The pCLAMP or MultiClamp Commander software cannot be fully displayed on the whole screen of the monitor. What should I do?
There are two possible causes for this happening. First, the Windows resolution is not optimal. We suggest a screen resolution of 1920*1080 or the same ratio. Second, a non-English version of Windows is used. Please change the system locale setting to English.
Latest Resources
Customer Breakthrough

SUCCESS STORY
University of Michigan use our Axon instruments to investigate NMDAR receptor blockers

Specifications & Options of pCLAMP 11 Software Suite
*Supports all previous versions in a model line.
**We only support Professional, Enterprise, and Ultimate editions but not Home edition.
Axon™ pCLAMP®, Axon™ DigiData™ and Windows Operating System Compatibility Table
Consult the table below to determine pCLAMP software compatibility with various AXON digitizers and Windows operating systems.
Notes:
a.) Only U.S. versions of Windows operating systems are fully supported, and only a computer with authentic Windows is supported, i.e., emulators and virtual machines are not supported. pCLAMP version 10.3 or higher are the only installers that support 64-bit Operating Systems.
b.) Update from 8.0 or 8.1 to 8.2 is free. Only the 32-bit installer of 8.2 runs on Windows XP (see download link above).
c.) Update from 9.0 or 9.1 to 9.2 is free. pCLAMP 9 software is not supported for use under Windows 7 (32- or 64-bit versions).
d.) All updates within 10.x (e.g. from 10.0 to 10.7) are free.
e.) Windows Home Edition is not supported.
f.) Digidata 1440, 1550, 1550A, and 1550B are supported on 10.7.
g.) Use of the Digidata 1320A, 1321A or 1322A on 64-bit Operating Systems is not supported. The Digidata 132x series are only supported up to pCLAMP versions 10.3.
h.) MiniDigi 1B is required for use under 64-bit Operating Systems.