MetaMorph Microscopy Automation and Image Analysis Software [Discontinued]
*PLEASE READ* Notice of Discontinuation
Molecular Devices continuously evaluates microscopy automation and image analysis technologies to ensure a product meets our customers’ expectations. After careful consideration, we have decided to cease offering the MetaMorph Software Suite, including MetaFluor and MetaVue, after July 7, 2023. This decision aligns with our strategy of providing new innovative products with improved security, design, and functionality in support of scientific research.
Microscope imaging software with optional microscopy analysis software
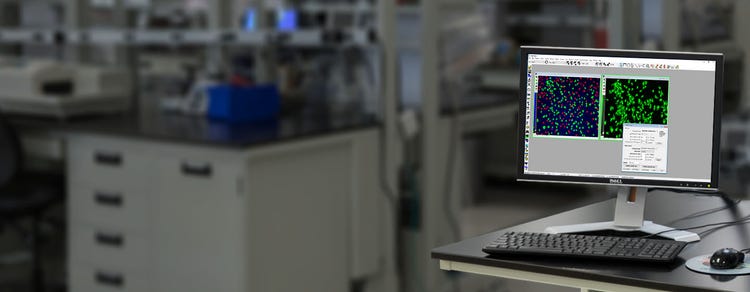
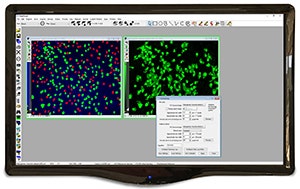
The MetaMorph® Microscopy Automation and Image Analysis Software automates acquisition, device control, and image analysis. It easily integrates dissimilar fluorescent microscope hardware and peripherals into a single custom workstation. The software offers many user-friendly application modules for biology-specific analysis. Two complementary packages, MetaFluor® software for fluorescence ratio imaging, and MetaVue® software for basic image acquisition and processing, are included in the portfolio.

Support third-party microscopes
MetaMorph software works with many commercially available microscopes, laser launches, TIRF optics, and can be enabled on previously-installed imaging systems compatible with MetaMorph software.

Measure fluorescence ratio imaging
MetaFluor® Fluorescence Ratio Imaging Software is designed for single or multi-wavelength intracellular ion measurements to provide greater insight to ion exchange and intracellular function.

Document and analyze images
MetaVue™ Research Imaging System is a simple, easy-to-use software application for acquiring and processing images, performing graphics functions, and archiving and retrieving images.
Resolving Molecular Organization and Dynamics Using Localization-Based Super-Resolution Microscopy
Features

Real-time image processing
Image process is supported by a graphics processing unit hardware acceleration. It resolves sub-cellular objects as small as 20 nm spatially and 40 nm axially.

Multi-dimensional acquisition module
Allows for the capture of complex acquisition sequences using a flexible, guided user interface.

Integrated morphometric analysis
Measures and categorizes objects into discreet user-definable classes based on any combination of morphometric parameters, such as shape, size, or optical density.

Scan slide module
Automates the acquisition of multiple images and then stitches them seamlessly together. Ideal for large tissue samples, this ensures reproducibility while taking the guesswork out of tiling experiments.

Device and camera streaming
Accelerates image capture rate and simultaneously transfers images to memory during acquisition, capturing dynamic cellular events for applications such as live cell/kinetic imaging.

4D viewer with 3D measurements
Tools for multidimensional visualization including stacks of sequential images, multiple Z-sections, wavelengths, time points, and positions. Data can be rendered for 3D isosurface viewing and rotation.